Sections
Dashboard viewingVisualization CreatingShare dashboardHome pageActivity historyDashboard editingBuilderDASHBOARD EDITING
Builder - visualization constructor on Datawiz BI service
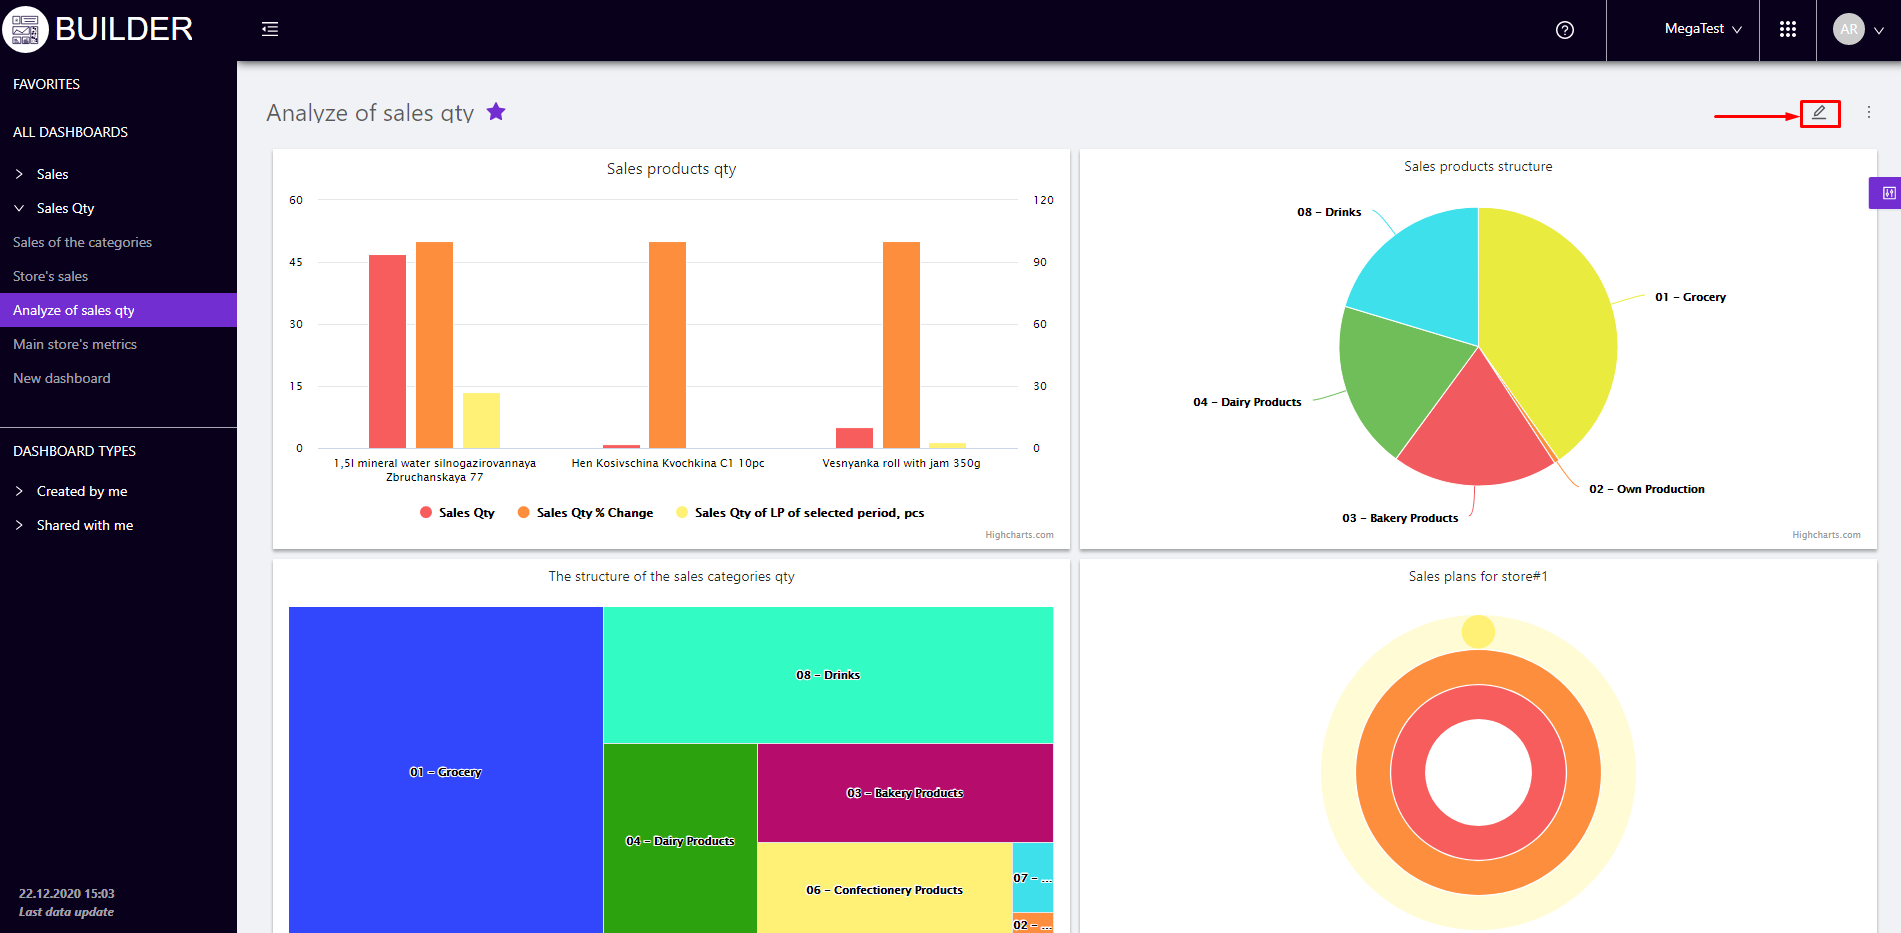
To go to the page Editing a dashboard, you need to open the dashboard to view and press the button (in the upper right corner of the page).
On the page Editing a dashboard you can:
- change the name of the dashboard;
- change the size and placement of visualizations;
- add a new visualization;
- enable / disable preview filters.
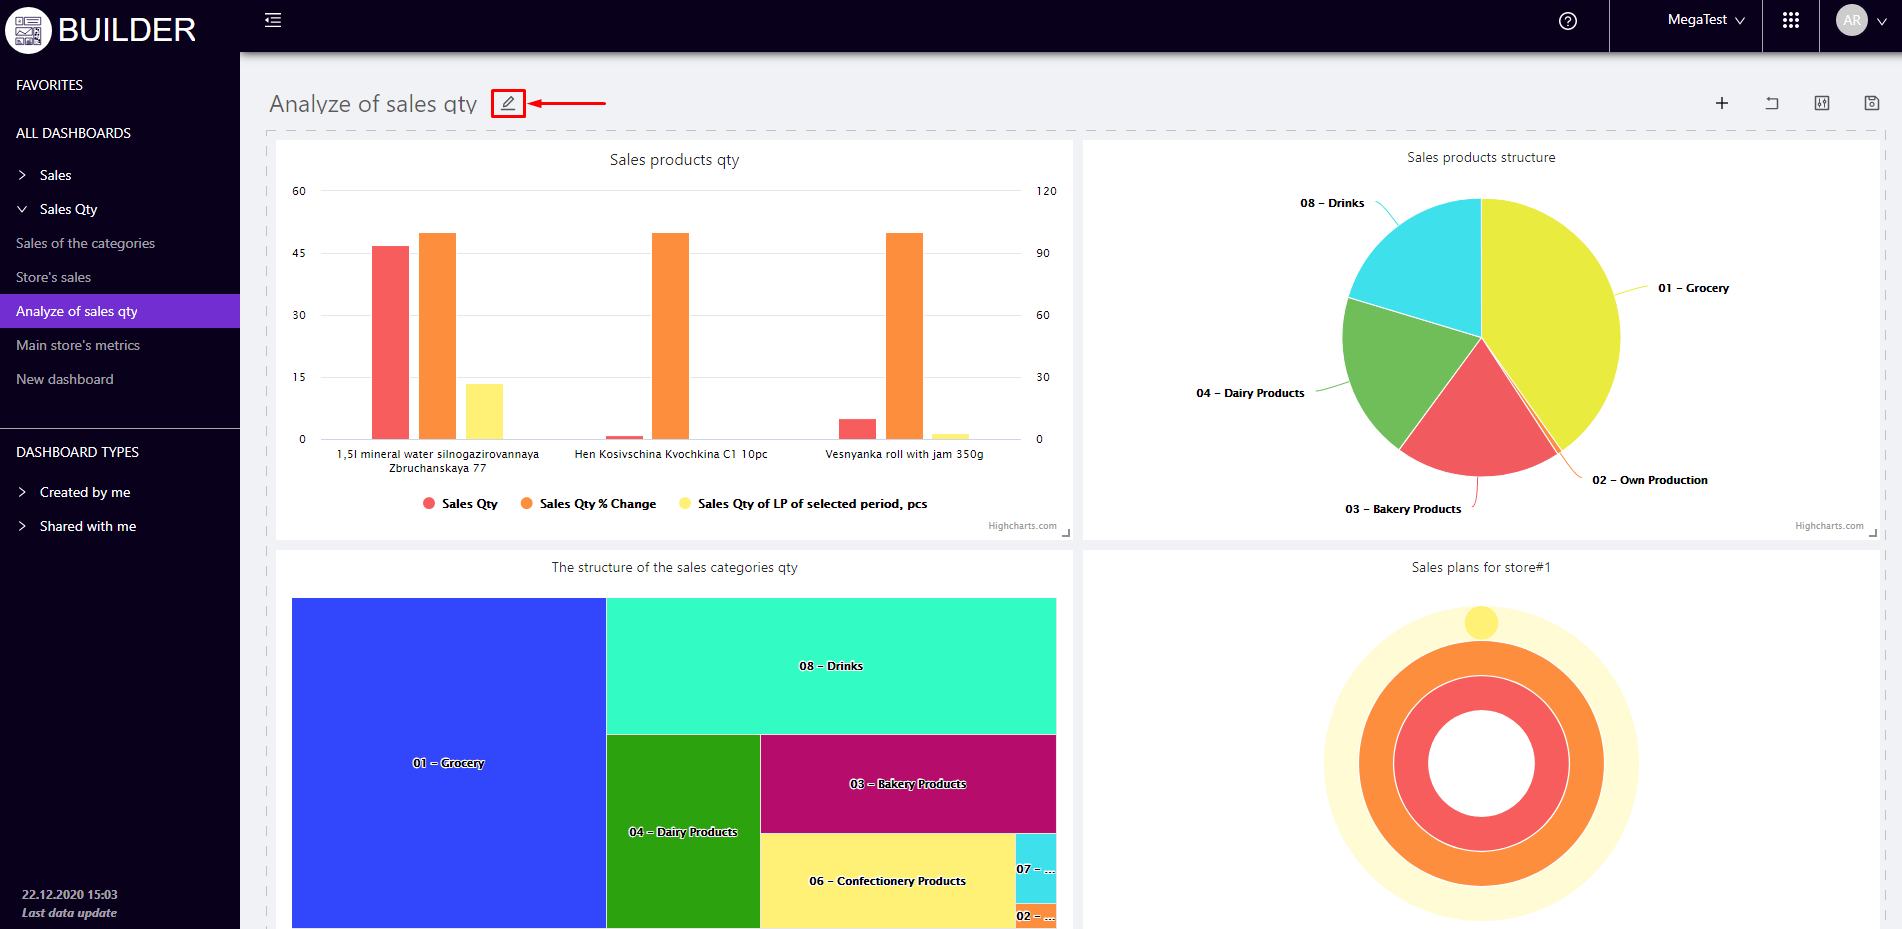
Button (on the left side next to the name of the dashboard) allows you to change the name of the dashboard.
To change the size of the visualization, simply move the cursor to its corner so that the arrows appear. Next, you need to hold down the left mouse button and stretch / reduce the image to the desired size.
To move the visualization on the dashboard, you need to click the left mouse button and move it to the desired location.
The interface buttons allow to perform the following editing functions:
- change the name of the dashboard;
- add a new visualisation by opening the Create Visualisation window;
- copy an image and place it next to it on the dashboard with the "copy" mark;
- delete a visualisation from the dashboard;
- cancel editing actions and open the Dashboard View page;
- set up filters for displaying visualisations on the dashboard;
- save changes and return to the Dashboard View page.
It is possible to open a modal window with a list of filters (period, brands, categories, products, stores, suppliers, producers, assortment types, category managers, receipt markers, types of clients, markers) and switches that activate/deactivate them.
The deactivated filter will automatically disappear from the filters on the page Viewing dashboards.
Filters can be changed in places, which adjusts the priority of their application.