Sections
Basket AnalysisQuadrant analysisProducers analysisStore cardProduct CardBrand salesPlanogram EfficiencyLost SalesSuppliers salesCategories salesCategory managersStores salesSales ChangeCategory CardMarkers comparisonProducts salesUnsaleable productsPrediction of OoS24-Hour AnalysisProducts movementEffectiveness of сashiersProducts for adjustmentPOS-terminal TrafficSales PlansNew SKUEffectiveness of Loyalty ProgramPromo CardStatistic of Loyalty ProgramCustomer Loyalty SegmentationLoyalty CardComparative DynamicsReceiptsStock MonitoringMainPromotion AnalysisRFM - analysisBASKET ANALYSIS
Reports on Datawiz BI service
The "Basket Analysis" report allows to identify a typical shopping basket at different times, prices and qty.
It contains tabs: 2 dimensions and 3 dimensions.
Tabs summarize information about sales categories and products, showing typical patterns of client behavior. Tabs functionalities allow you to:
- determine what clients buy at different times of the day and days of the week;
- form targeted marketing activities;
- adjust the display of products in the trading place.
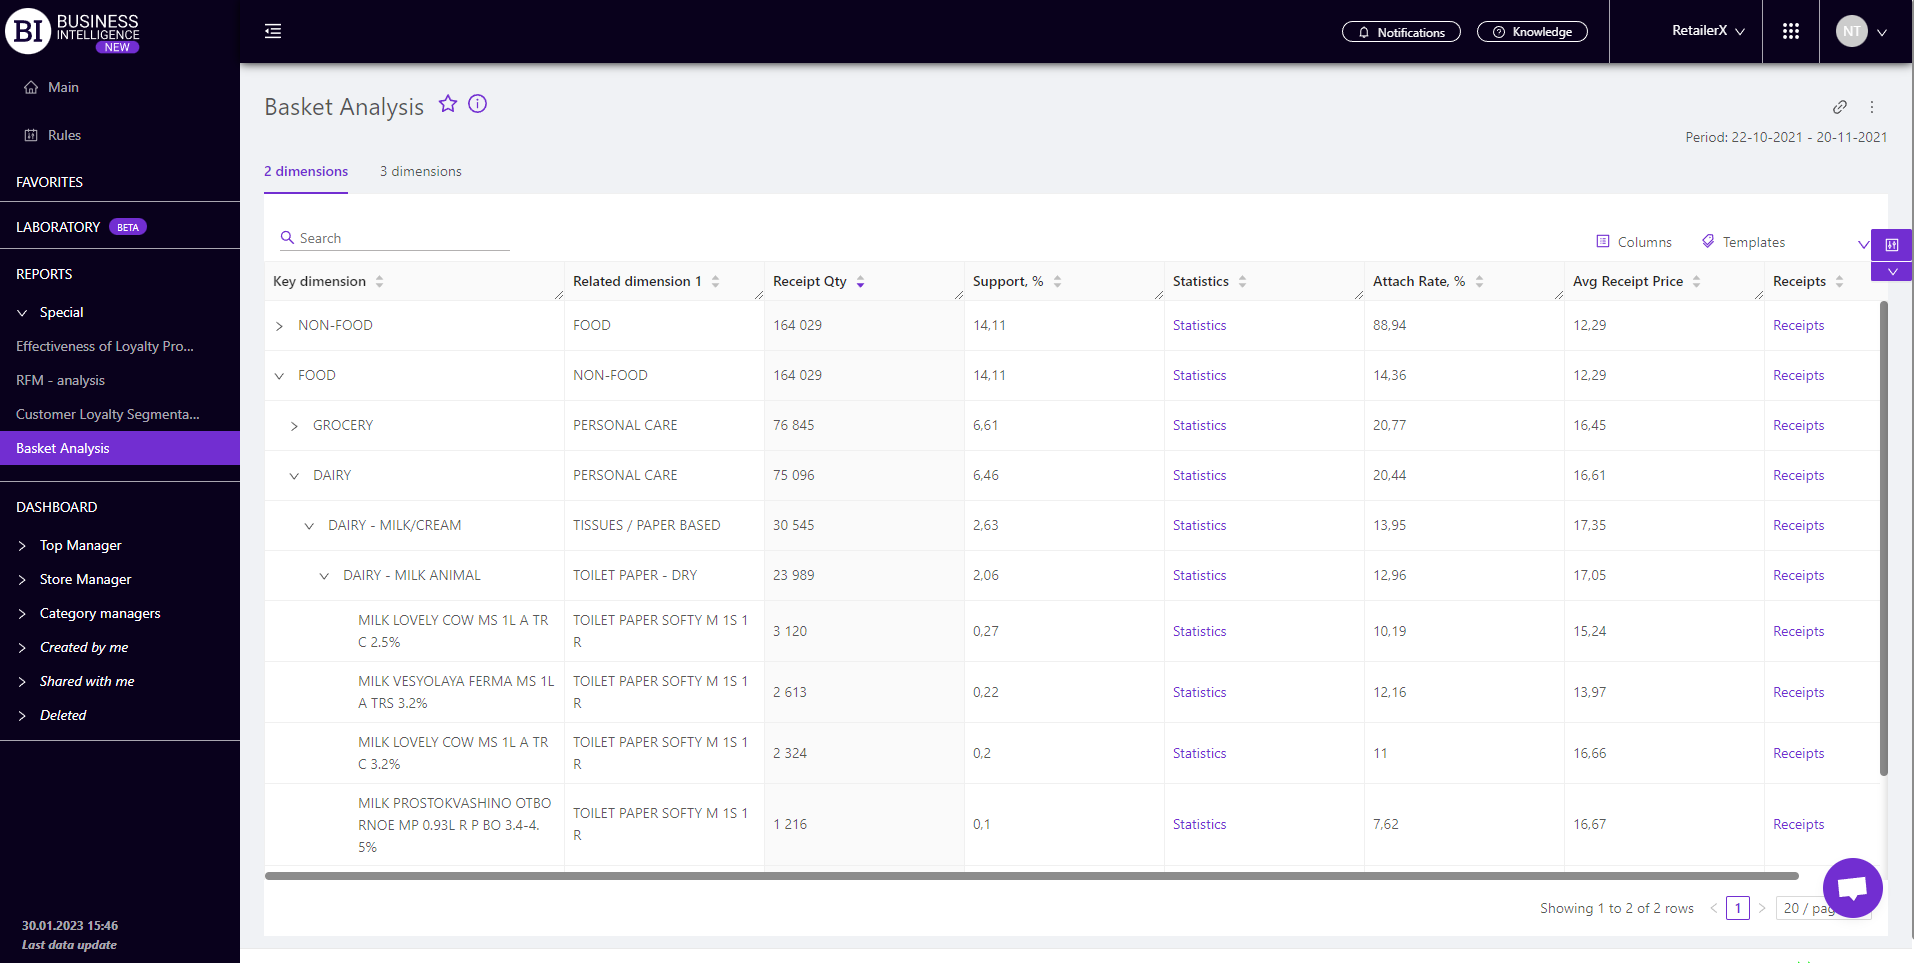
Note! The "2 dimensions" tab displays the baskets where the selected key dimension and another dimension with which it is sold are found. The "3 dimensions" tab shows sales of a key dimension with two concomitant dimensions.
Metrics
"Columns" button allows to choose the necessary metrics for generating a report.
Note! Access to viewing metrics according to the user's role is determined by the administrator. Contact your administrator to expand the access.
The clickable metric "Statistics" opens the report of the same name which contains detailed information about the selected basket.
The clickable metric "Receipts" opens the report "Receipts" where you can analyze in detail the positions of receipts of the relevant clients' LP.
"Templates" button - saves the configured report columns as a template.
On the right above the table context menuis opened where the user can select the following actions:
- "Save XLS" - saves table data to an xls-file.

To quickly find the necessary unit, enter the first letters/symbols of the unit name in the search field. The search works automatically, leaving all found matches in the table.
To reset the search results, click on the cross in the search field.
Statistics
Clicking on the "Statistics" metric in the report table opens a report of the same name which shows detailed information on the selected basket for the selected period.
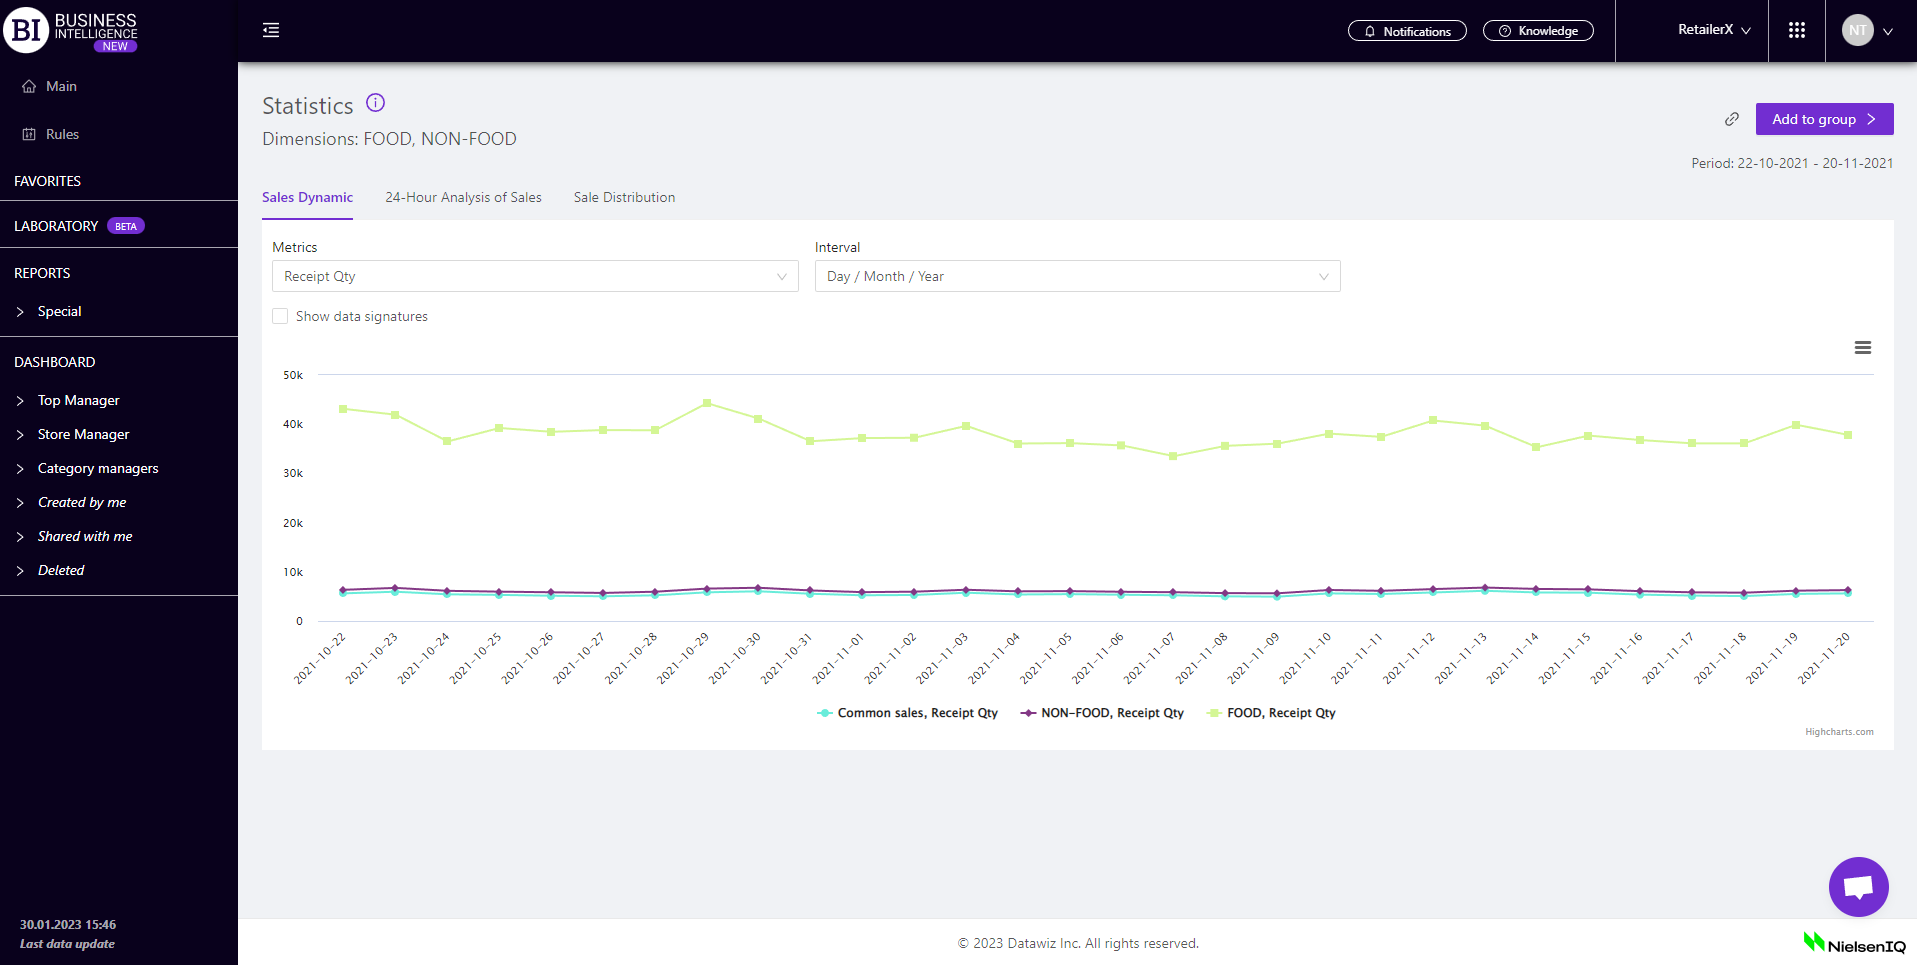
The report contains four tabs: Sales dynamics, 24-Hour Analysis of Sales, Sale Distribution, Market Basket Analysis.
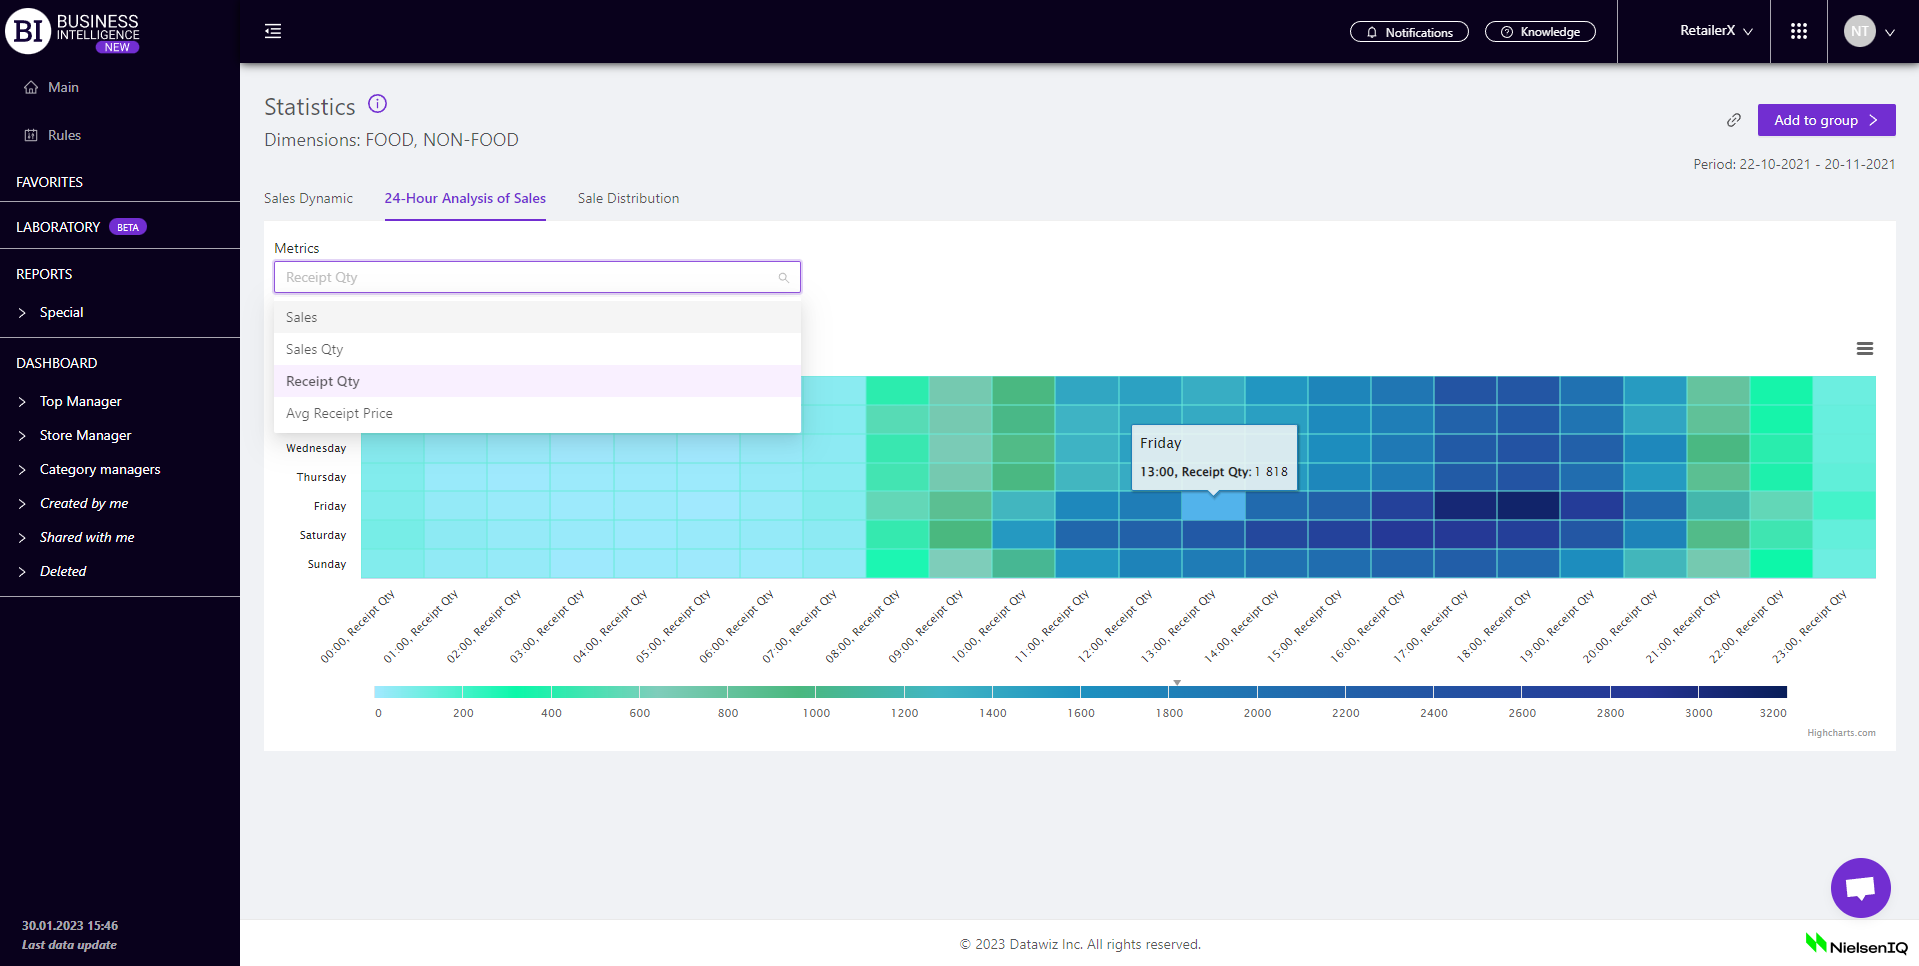
The "Sales Dynamics" tab is a graph that shows the dynamics of the main sales metrics for chosen dimensions (categories, products) for the selected period. One of the following metrics can be displayed for visualization: Sales, Receipt Qty, Sales Qty, Avg Receipt Price.
The "24-Hour Analysis of Sales" tab is a visualization that shows sales metrics with chosen dimensions (categories, products) by hours and days of the week.
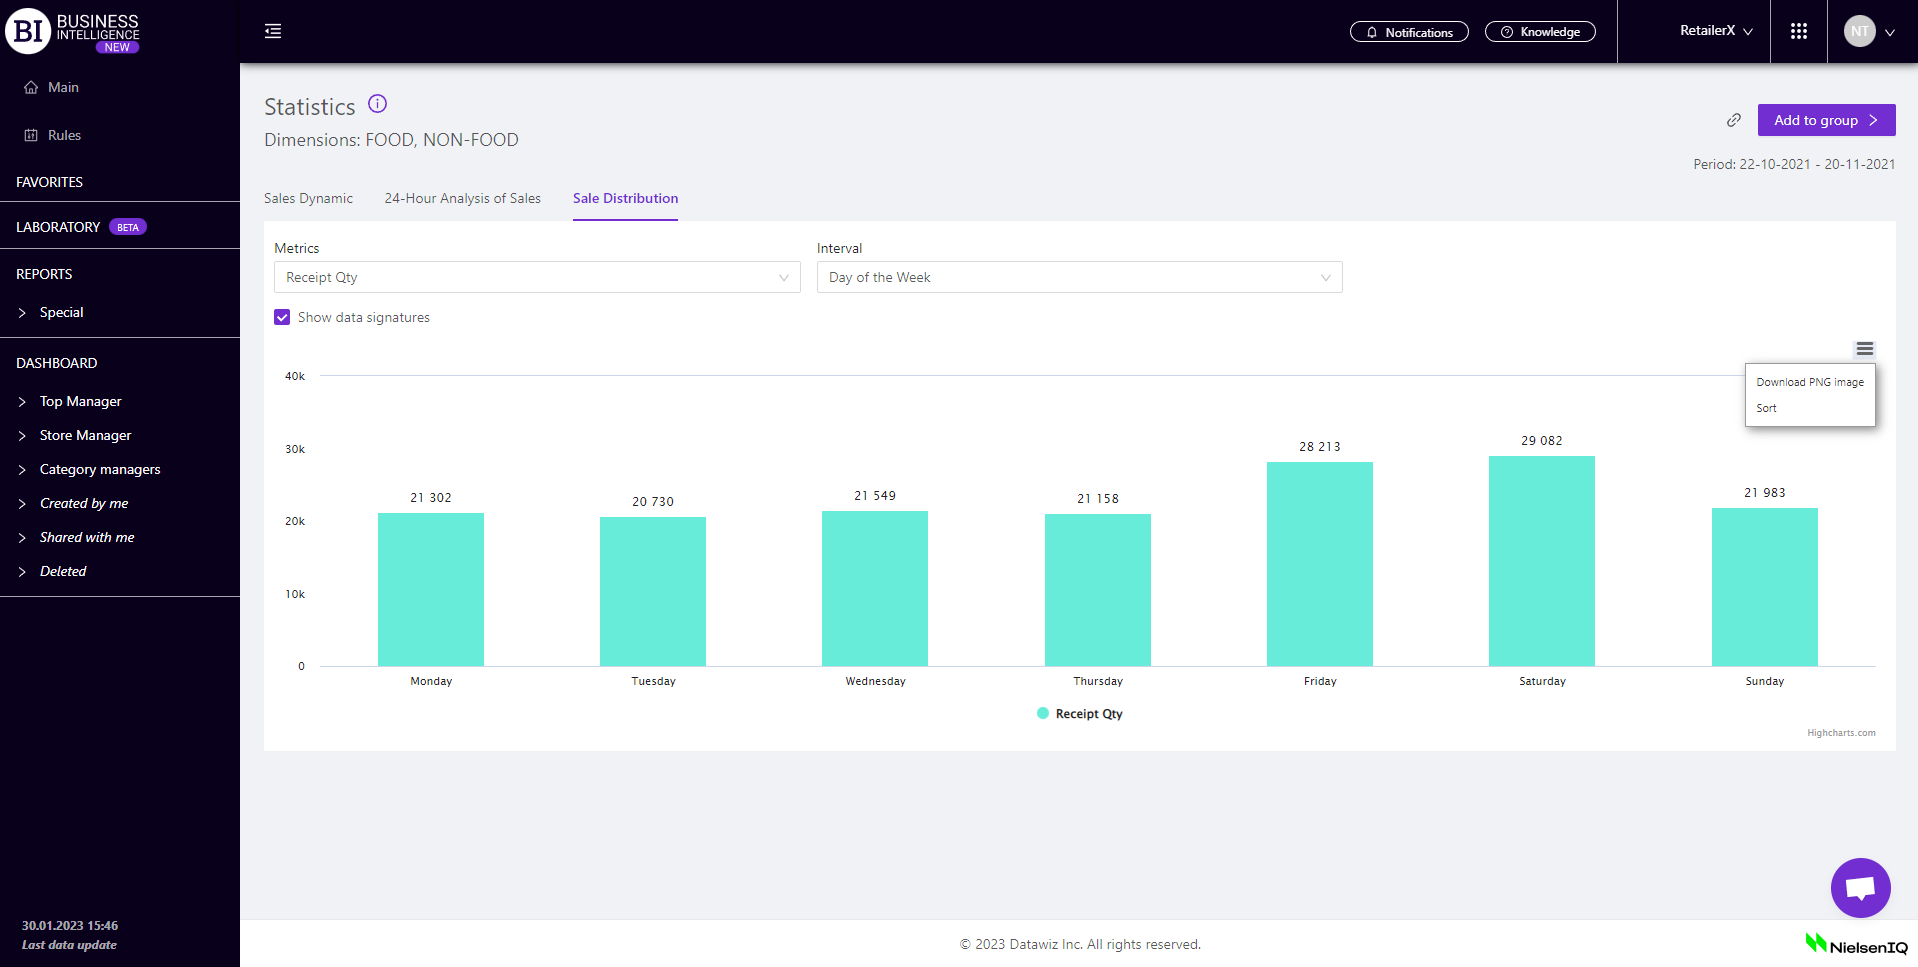
The "Sales Distribution" tab is a bar chart that shows the values of sales metrics with chosen dimensions (categories, products) by days of the week.
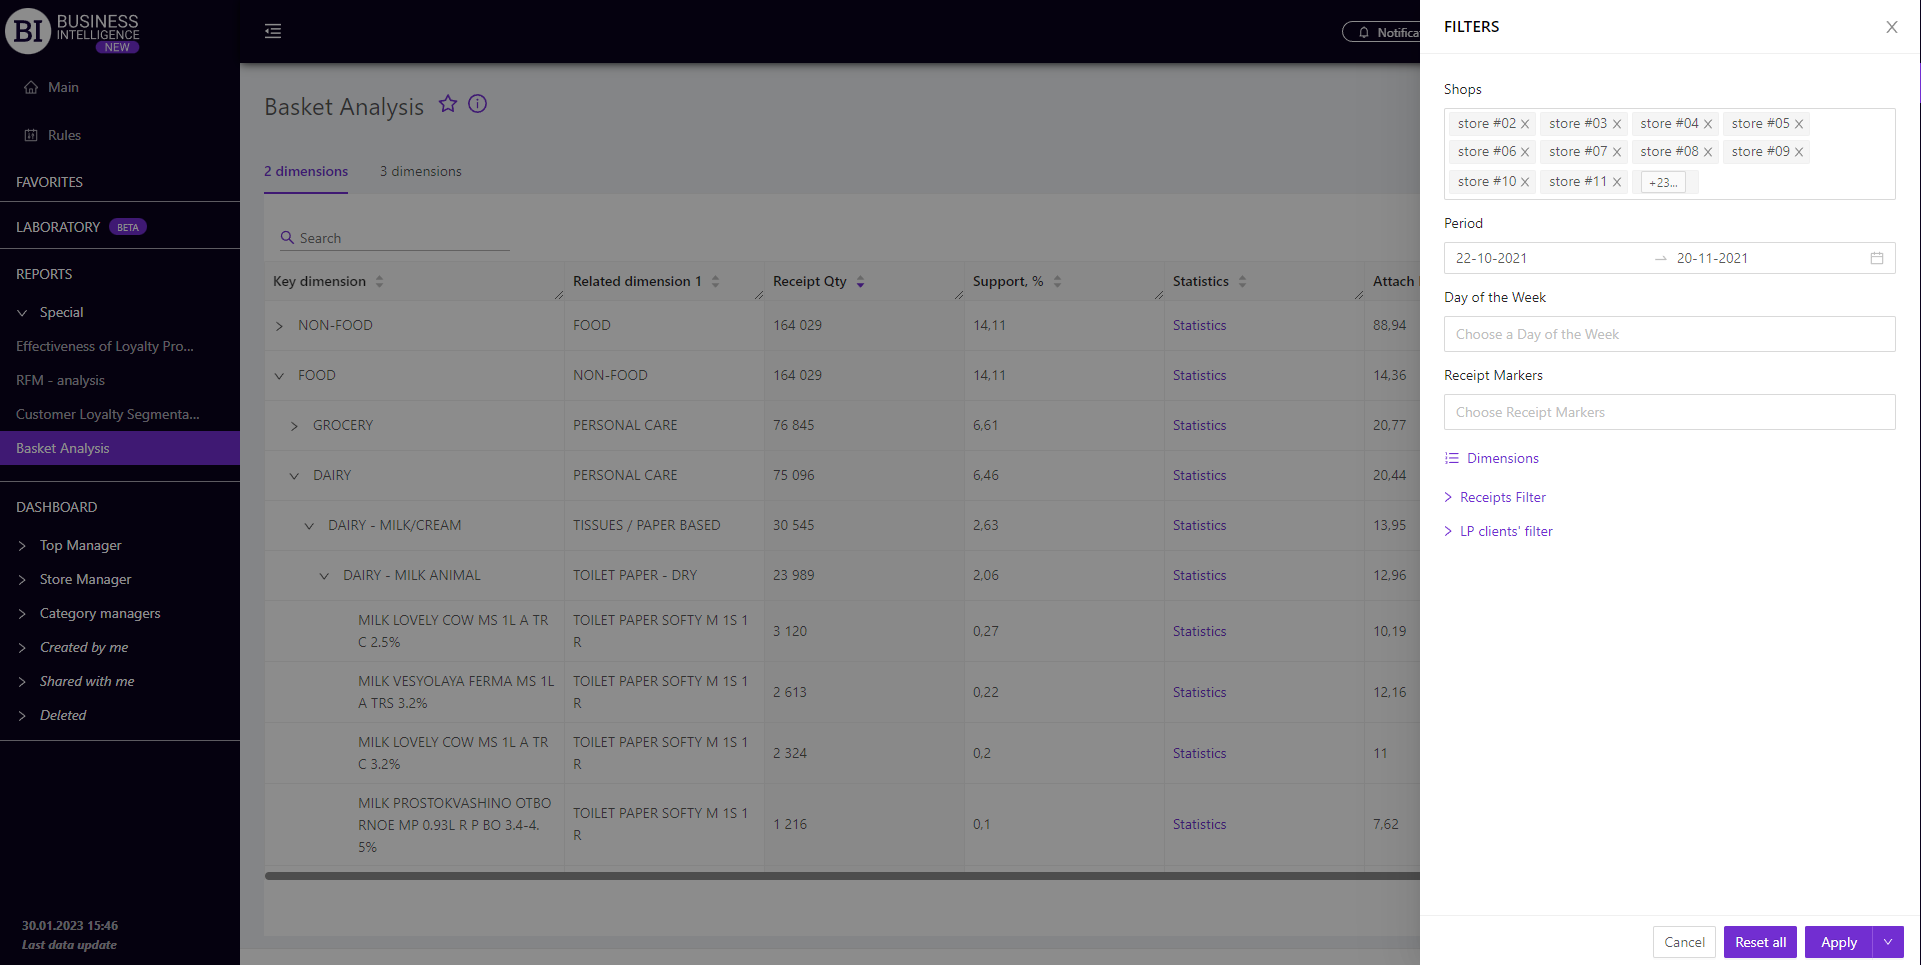
Filters
The selection of filters makes it possible to carry out the analysis within the specified conditions.
Filters button is placed on the right side above the report. Clicking on it opens a modal window with the following filters:
- Stores
- Period
- Day of the week
- Receipt markers
- Dimensions
- Receipts filter
- LP clients' filter