Sections
Brand salesStore cardProduct CardBasket AnalysisQuadrant analysisSales ChangeCategory managersSuppliers salesMarkers comparisonCategory CardProducts salesStores salesCategories salesProducers analysisStock MonitoringMainUnsaleable productsPrediction of OoS24-Hour AnalysisProducts movementEffectiveness of сashiersProducts for adjustmentPOS-terminal TrafficSales PlansPromotion AnalysisNew SKUEffectiveness of Loyalty ProgramPromo CardRFM - analysisStatistic of Loyalty ProgramCustomer Loyalty SegmentationLoyalty CardComparative DynamicsReceiptsPlanogram EfficiencyLost SalesQUADRANT ANALYSIS
Reports on Datawiz BI service
The "Quadrant Analysis" report allows to quickly analyze how a change of one metric affected the change of the other metric of product (brands, producers, shops) sales. It allows to divide the sections into quadrants on two metrics and conduct a detailed analysis.
The functionality of the report provides the opportunity to:
- choose a pair of interdependent metrics for the formation of 4 quadrants;
- track the impact of one sales metric on another for products (brands, producers, stores);
- identify problematic and promising products (brands, producers, stores) for the chain.
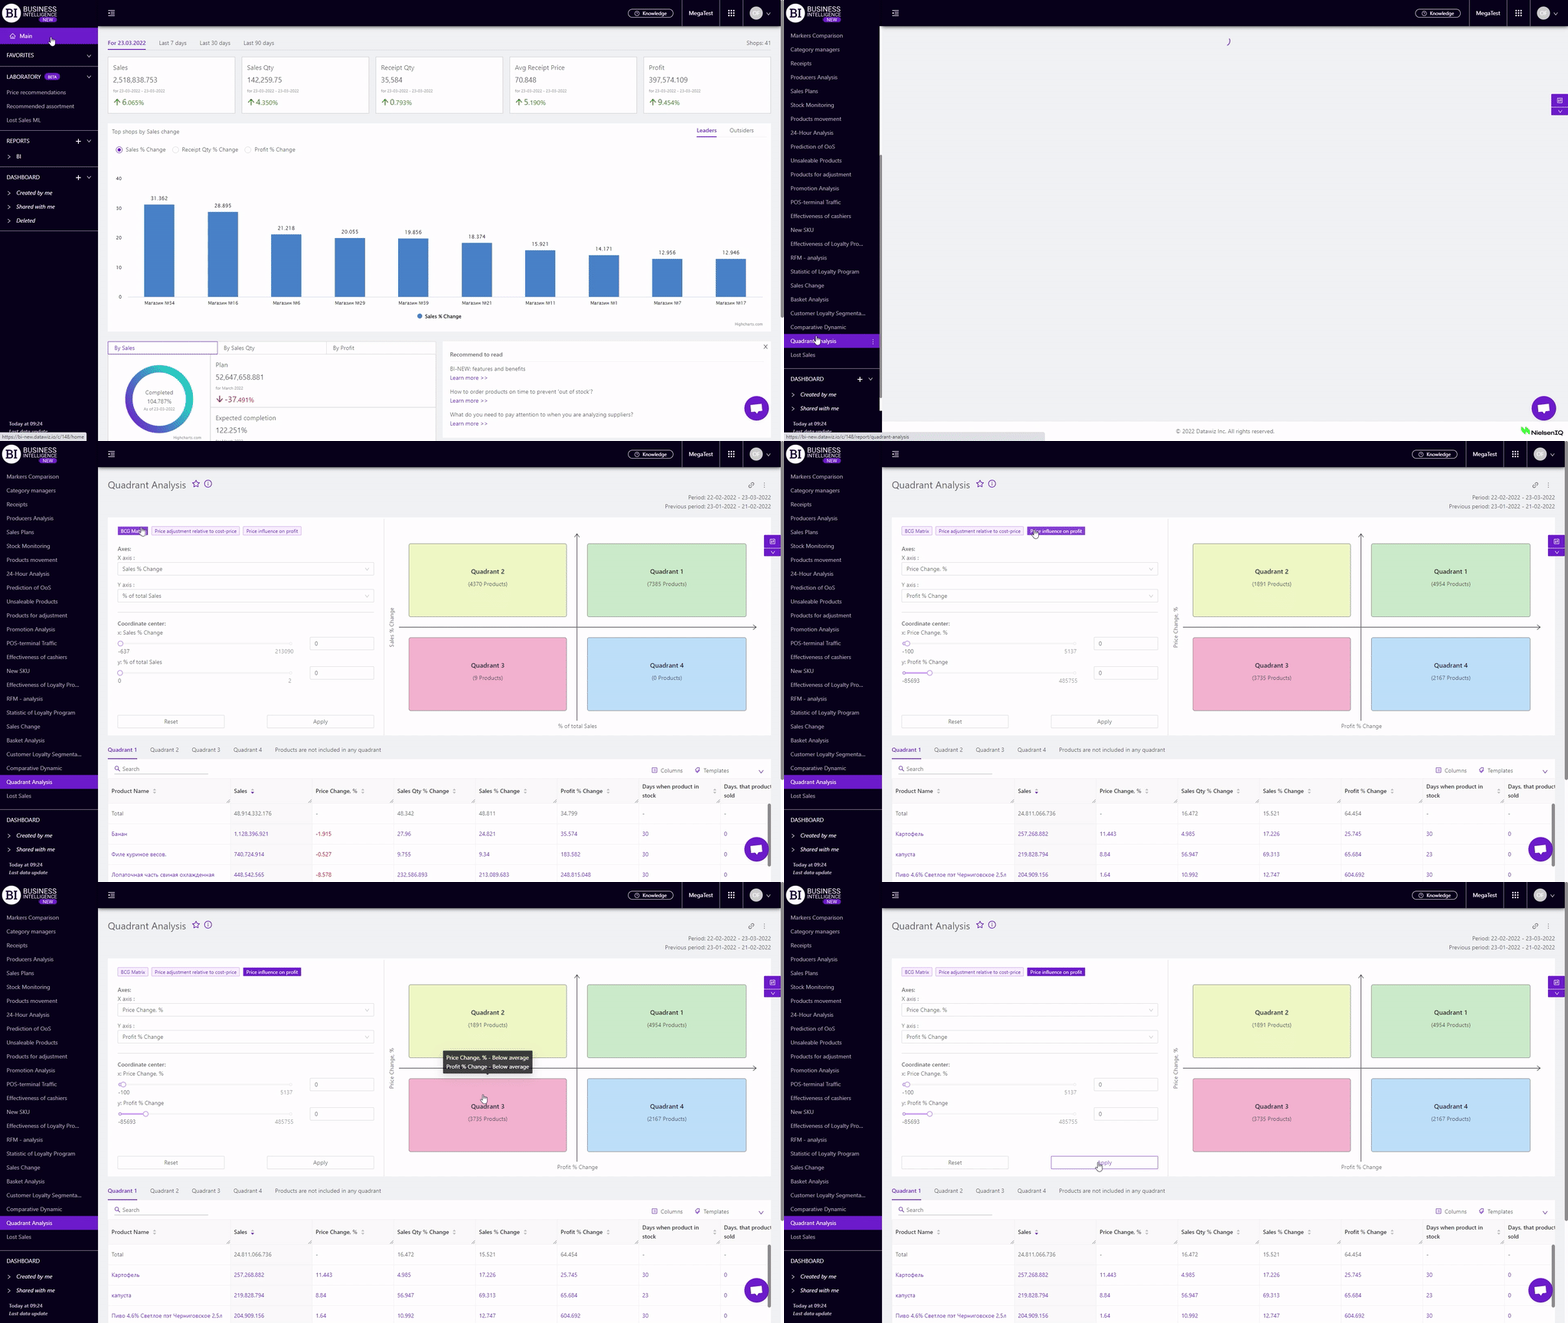
There is a quadrant analysis scheme at the top of the report. There are the following fields on the left which help you to choose the necessary parameters of the distribution of products (brands, producers, stores):
- Axes - allow to choose the following metrics for the x and y axes from the pop-up list:
- Coordinate Center - allows to set the value of the middle of the sample, using one of three following methods:
- enter a value in the field manually;
- decrease or increase the values using up and down arrows in the manual input field;
- set the value by moving the slide bar on the slider.
Note! By default, the center of coordinates is determined by the median principle.
The median is a number that divides the distribution series into two equal parts by their qty.
The qty of products (brands, producers, stores) included in it is displayed under the quadrant number. When you hover the cursor over the quadrant the following criteria are displayed: above or below average.
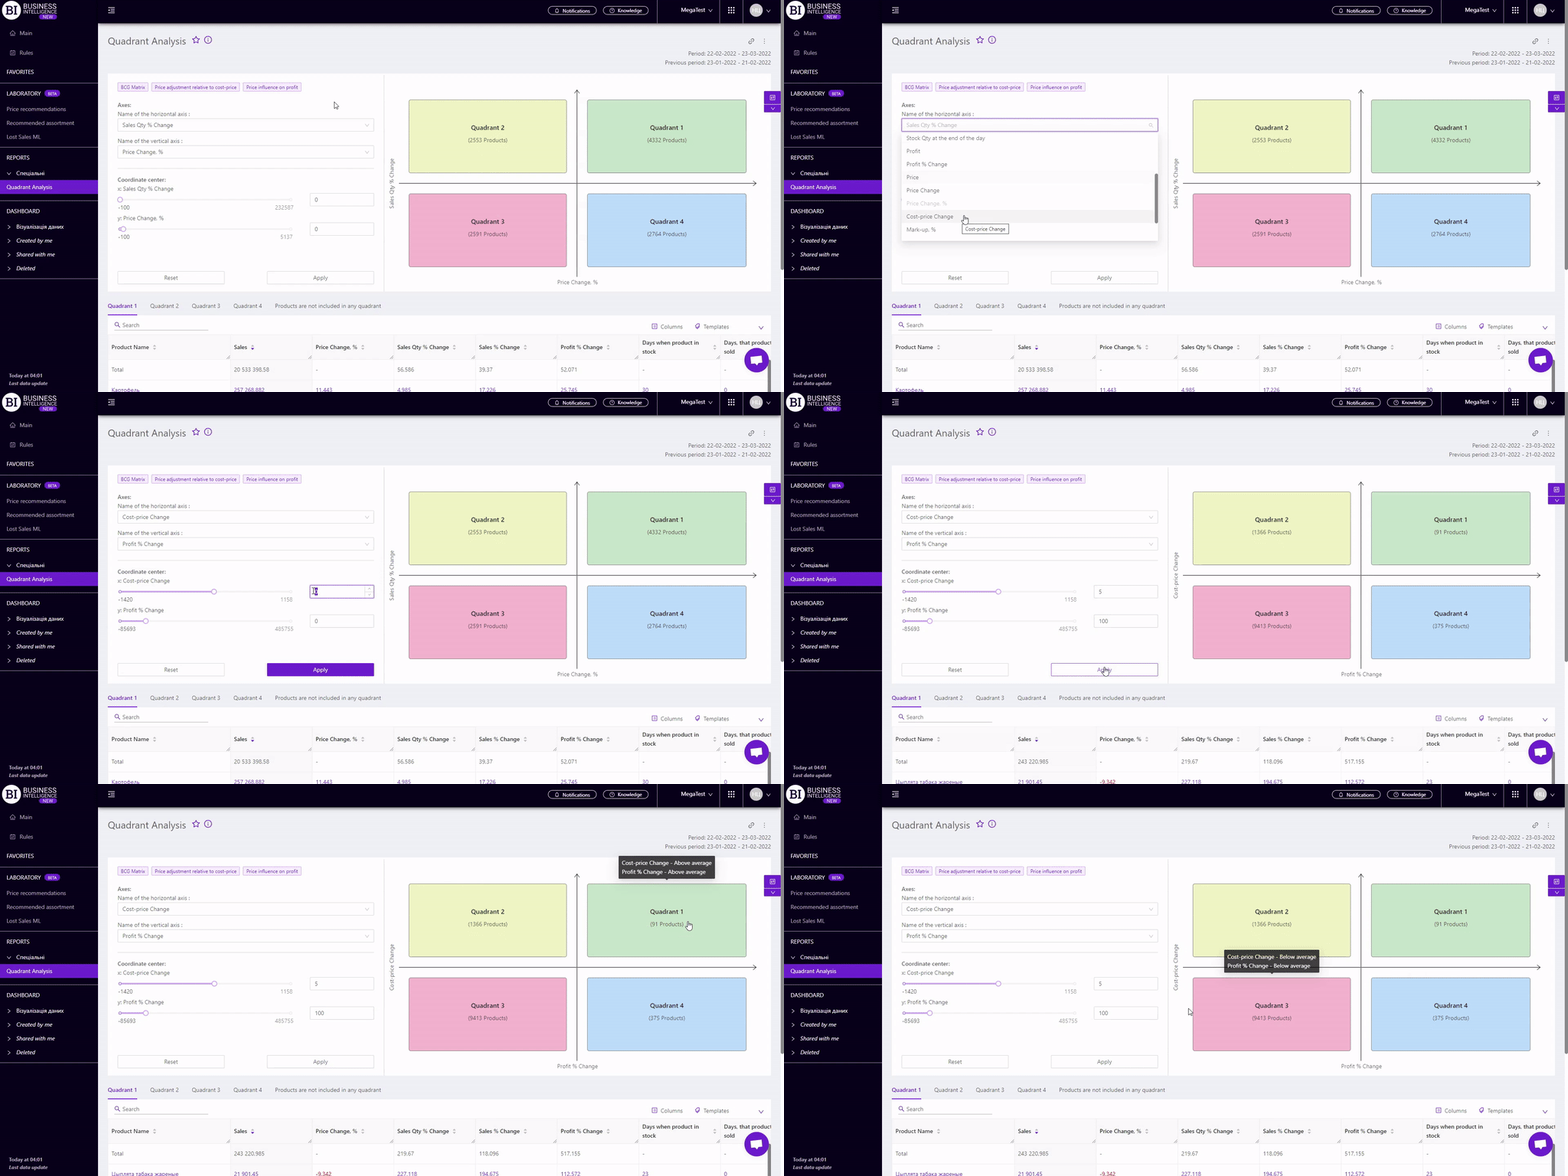
There is the table of the report with tabs for each of a quadrant under the scheme of quadrant analysis. You can go to the necessary tab by clicking on it or by clicking on the appropriate quadrant in the diagram.
Note! Products (brands, manufacturers, stores) that are not included in any of the four quadrants according to the set parameters are included in the tab "Products (brands, manufacturers, stores) that are not included in any quadrant".
The table of the report of the corresponding quadrant represents sales metrics for the products (brands, products, stores) which are included in it.
Metrics
"Columns" button allows to choose the necessary metrics for generating a report:
- Sales
- Sales Change
- Sales % Change
- % of total Sales
- Change % of total Sales, p.p.
- Sales Qty
- Sales Qty Change
- Sales Qty % Change
- Avg Sales Qty
- Receipt Qty
- Receipt Qty Change
- Receipt Qty % Change
- Stock Qty at the end of the day
- Stock price at the end of the day
- Stock Qty at the beginning of the day
- Profit
- Profit Change
- Profit % Change
- Price
- Price Change
- Price Change,%
- Primecost
- Primecost Change
- Primecost % Change
- Mark-up, %
- Margin, %
- Turns, %
- Qty of days with sales
- Days, that product not sold
- Days when product in stock
- Identifier
- Barcode
Note! Access to viewing metrics according to the user's role is determined by the administrator. Contact your administrator to expand the access.
Metrics highlighted in purple or red are clickable. Clicking on them opens a window with a flow chart of the chosen metric.
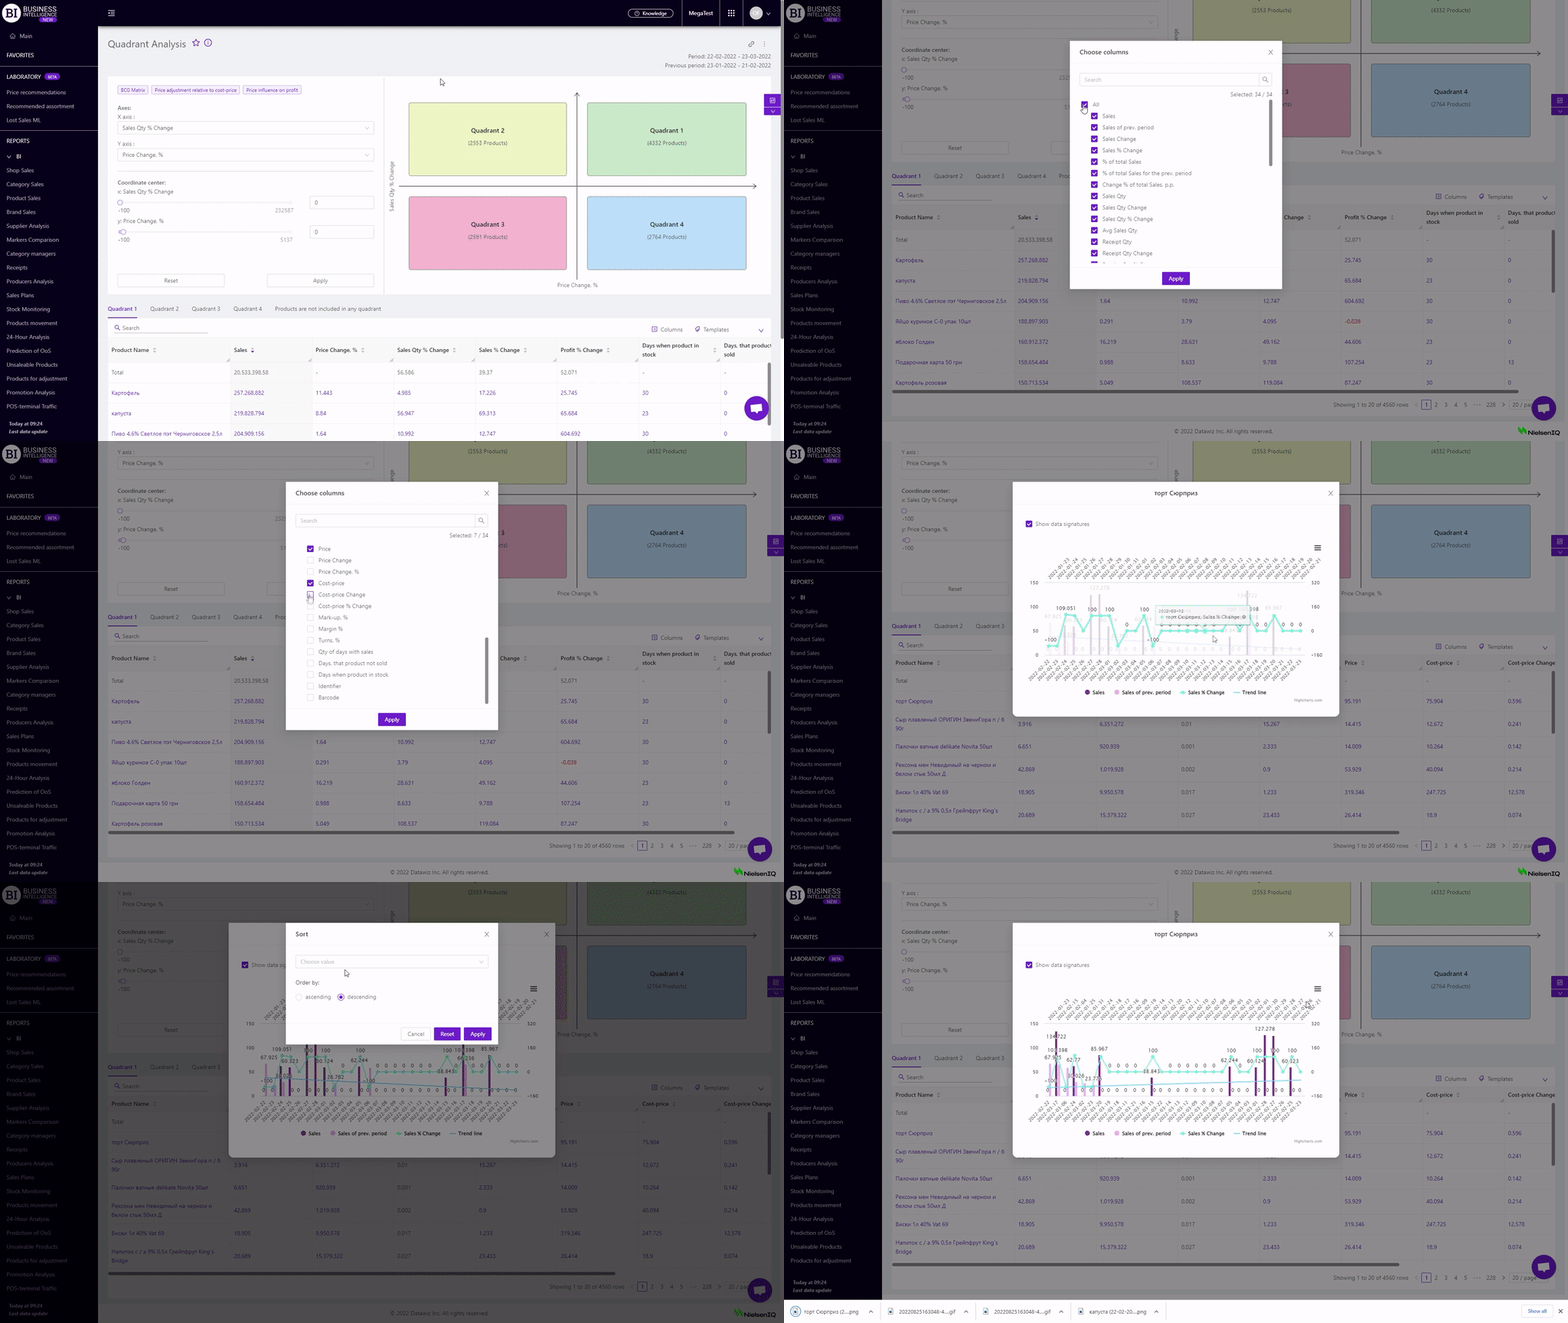
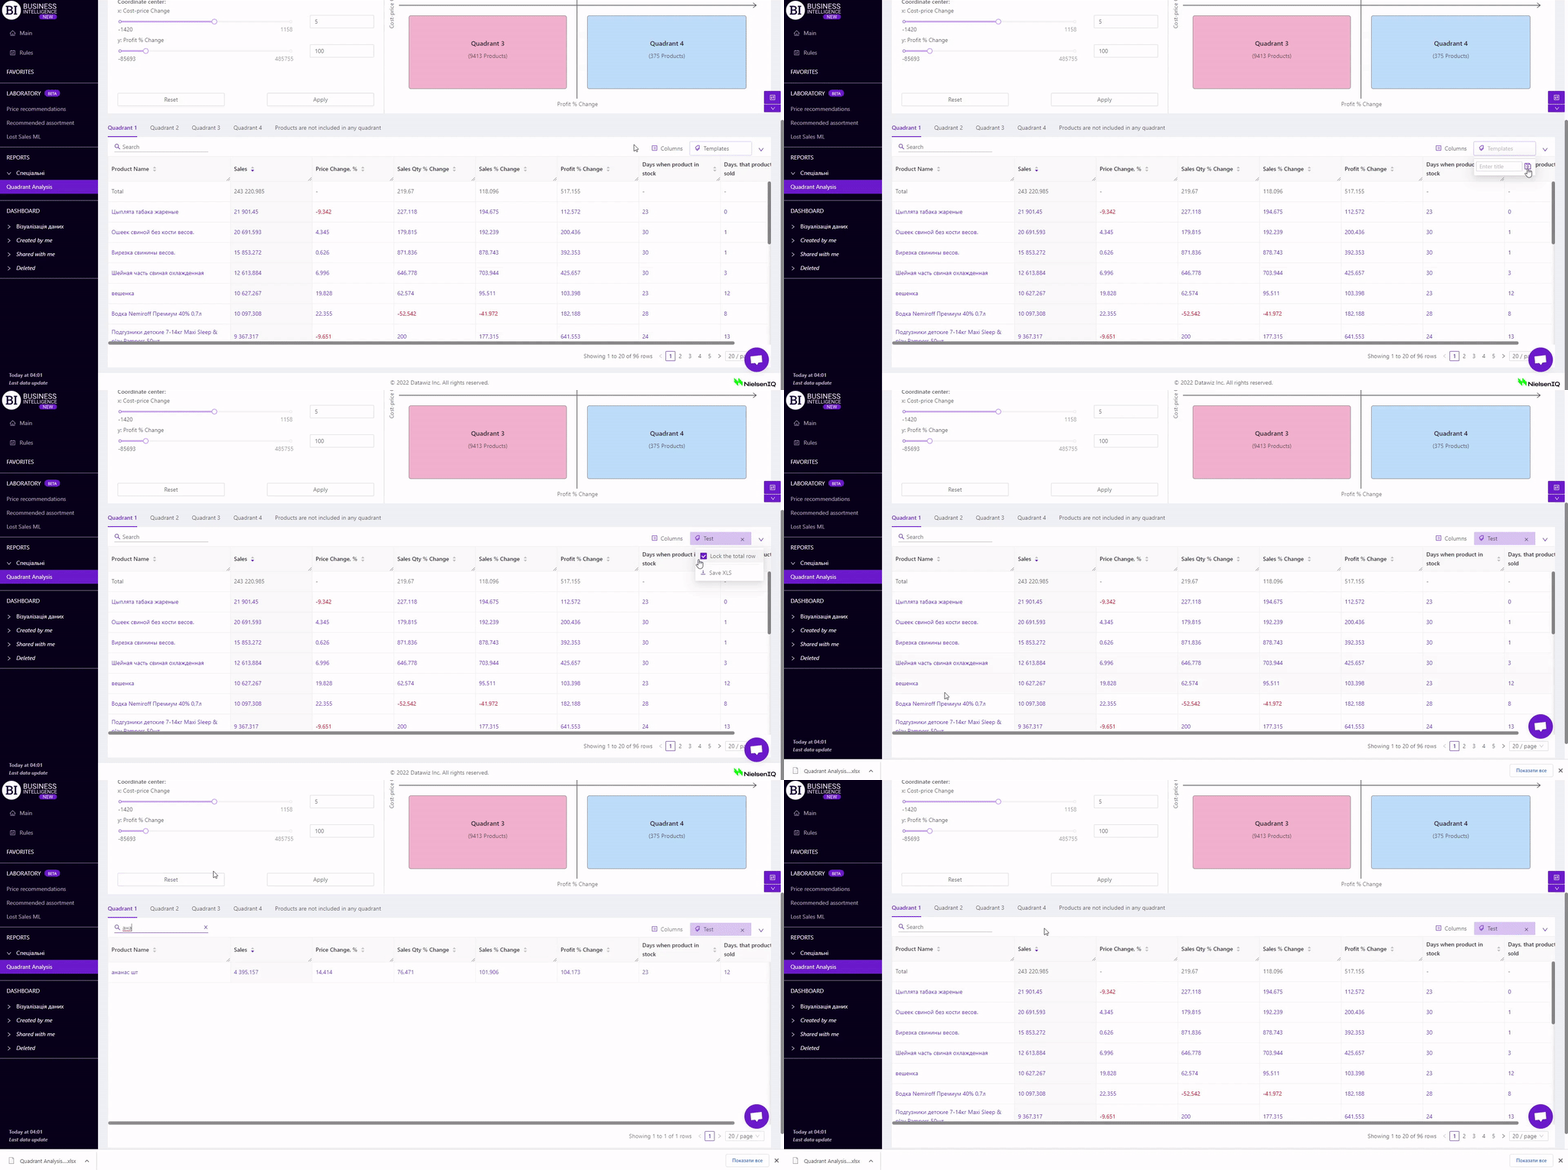
"Templates" button - saves the configured report columns as a template.
On the right above the table context menu is opened where the user can select the following actions:
- "Lock the total row" - fixes the "Total" row in the top row of the table.
- "Save XLS" - saves table data to an xls-file.
To quickly find the necessary unit, enter the first letters/symbols of the unit name in the search field. The search works automatically, leaving all found matches in the table.
To reset the search results, click on the cross in the search field.
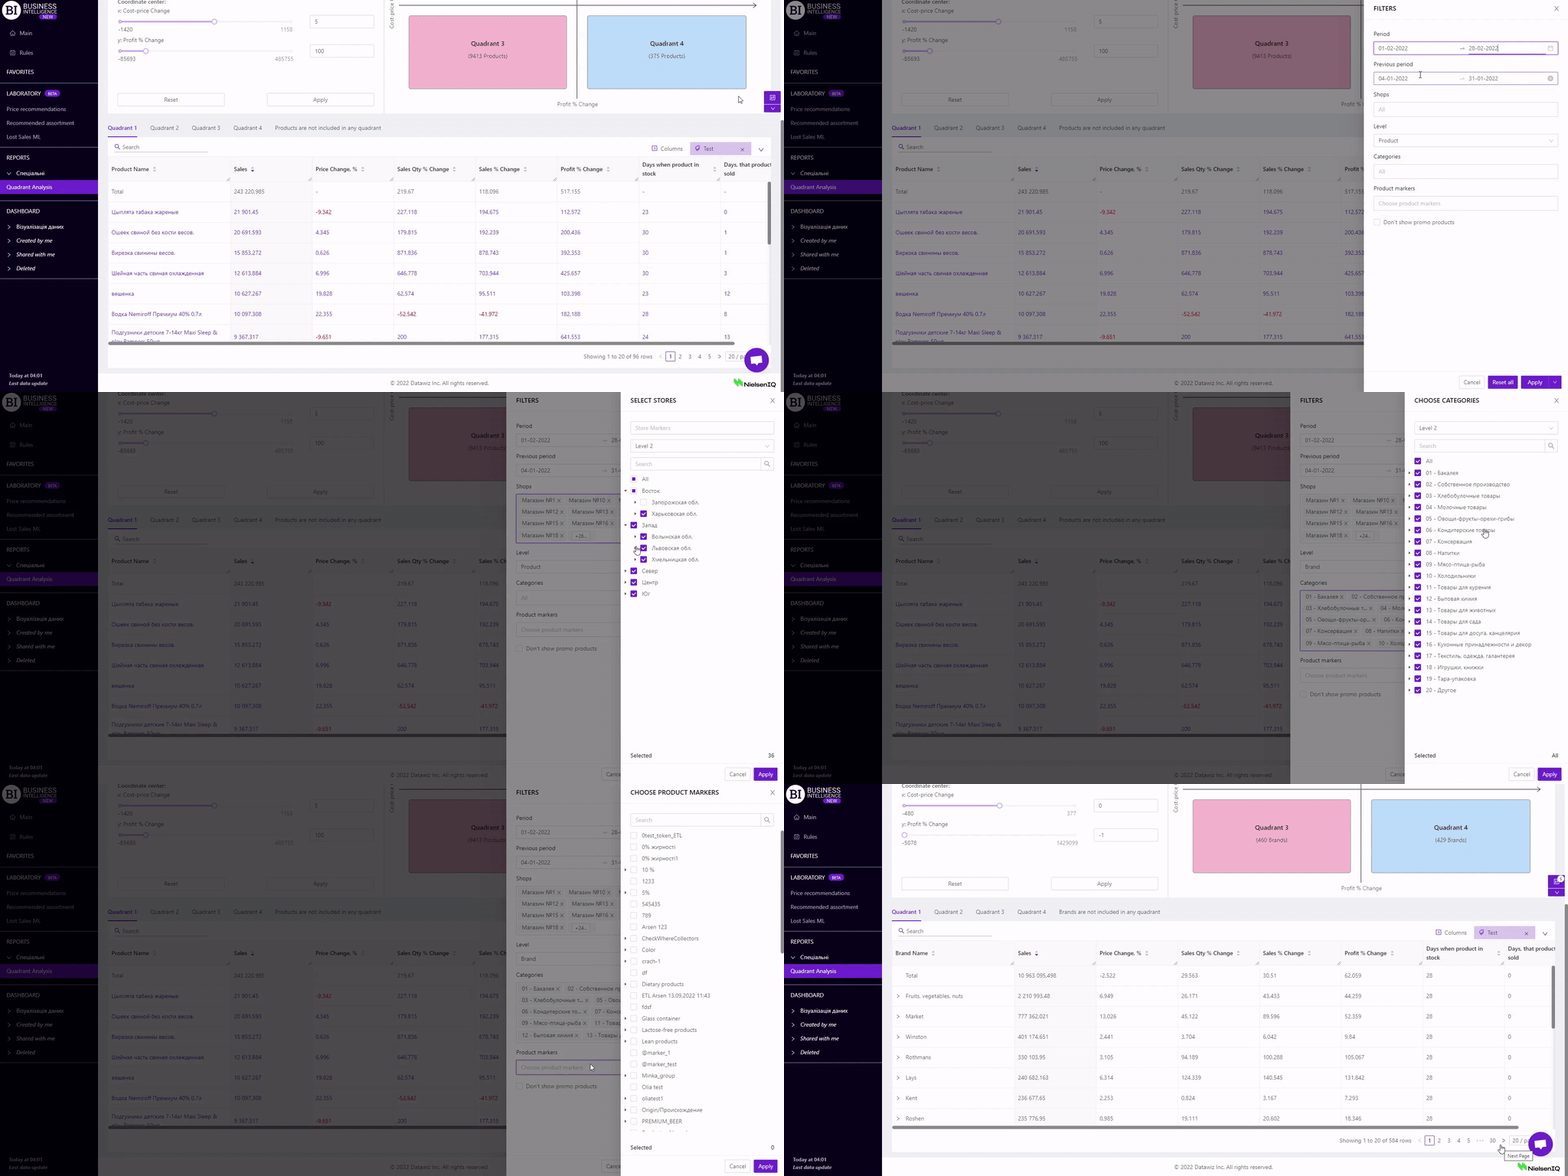
Filters
The selection of filters makes it possible to carry out the analysis within the specified conditions.
Filters button is located on the right side above the report. Clicking on it opens a modal window with the following filters:
- Period
- Previous Period
- Stores
- Level
- Categories
- Product Markers
- Don’t show promo products
