Sections
Basket AnalysisQuadrant analysisProducers analysisStore cardProduct CardBrand salesPlanogram EfficiencyLost SalesSuppliers salesCategories salesCategory managersStores salesSales ChangeCategory CardMarkers comparisonProducts salesUnsaleable productsPrediction of OoS24-Hour AnalysisProducts movementEffectiveness of сashiersProducts for adjustmentPOS-terminal TrafficSales PlansNew SKUEffectiveness of Loyalty ProgramPromo CardStatistic of Loyalty ProgramCustomer Loyalty SegmentationLoyalty CardComparative DynamicsReceiptsStock MonitoringMainPromotion AnalysisRFM - analysisPOS-TERMINAL TRAFFIC
Reports on Datawiz BI service
The "POS-terminal Traffic" report contains sales metrics that show the efficiency of the chain terminals. The data are presented in graphical and tabular form.
The functionality of the report allows to:
- evaluate the work of each terminal;
- identify cash registers with the highest and lowest pass rates;
- optimize the schedule of chain terminals according to the intensity of the customers' influx.
The report is formed for each store separately and for the chain as a whole. To choose a store click on "Chosen stores" field on the left above the table and choose the necessary store from the pop-up list.
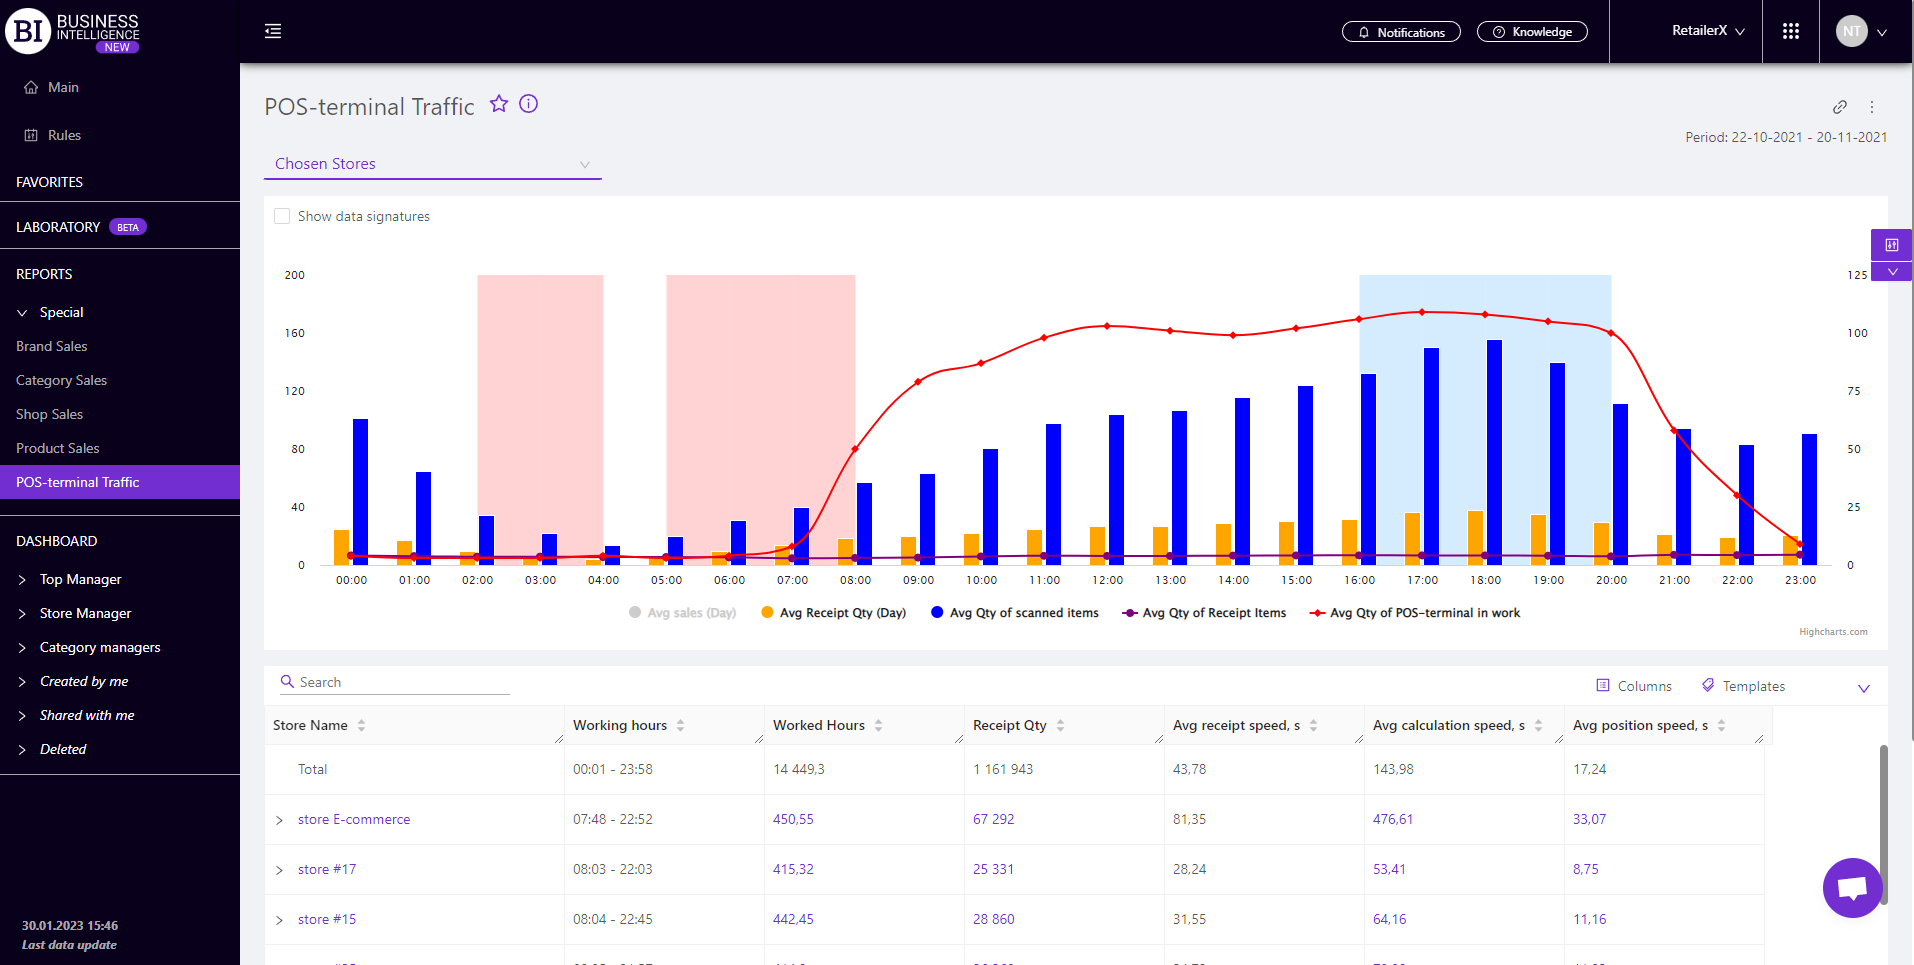
Metrics
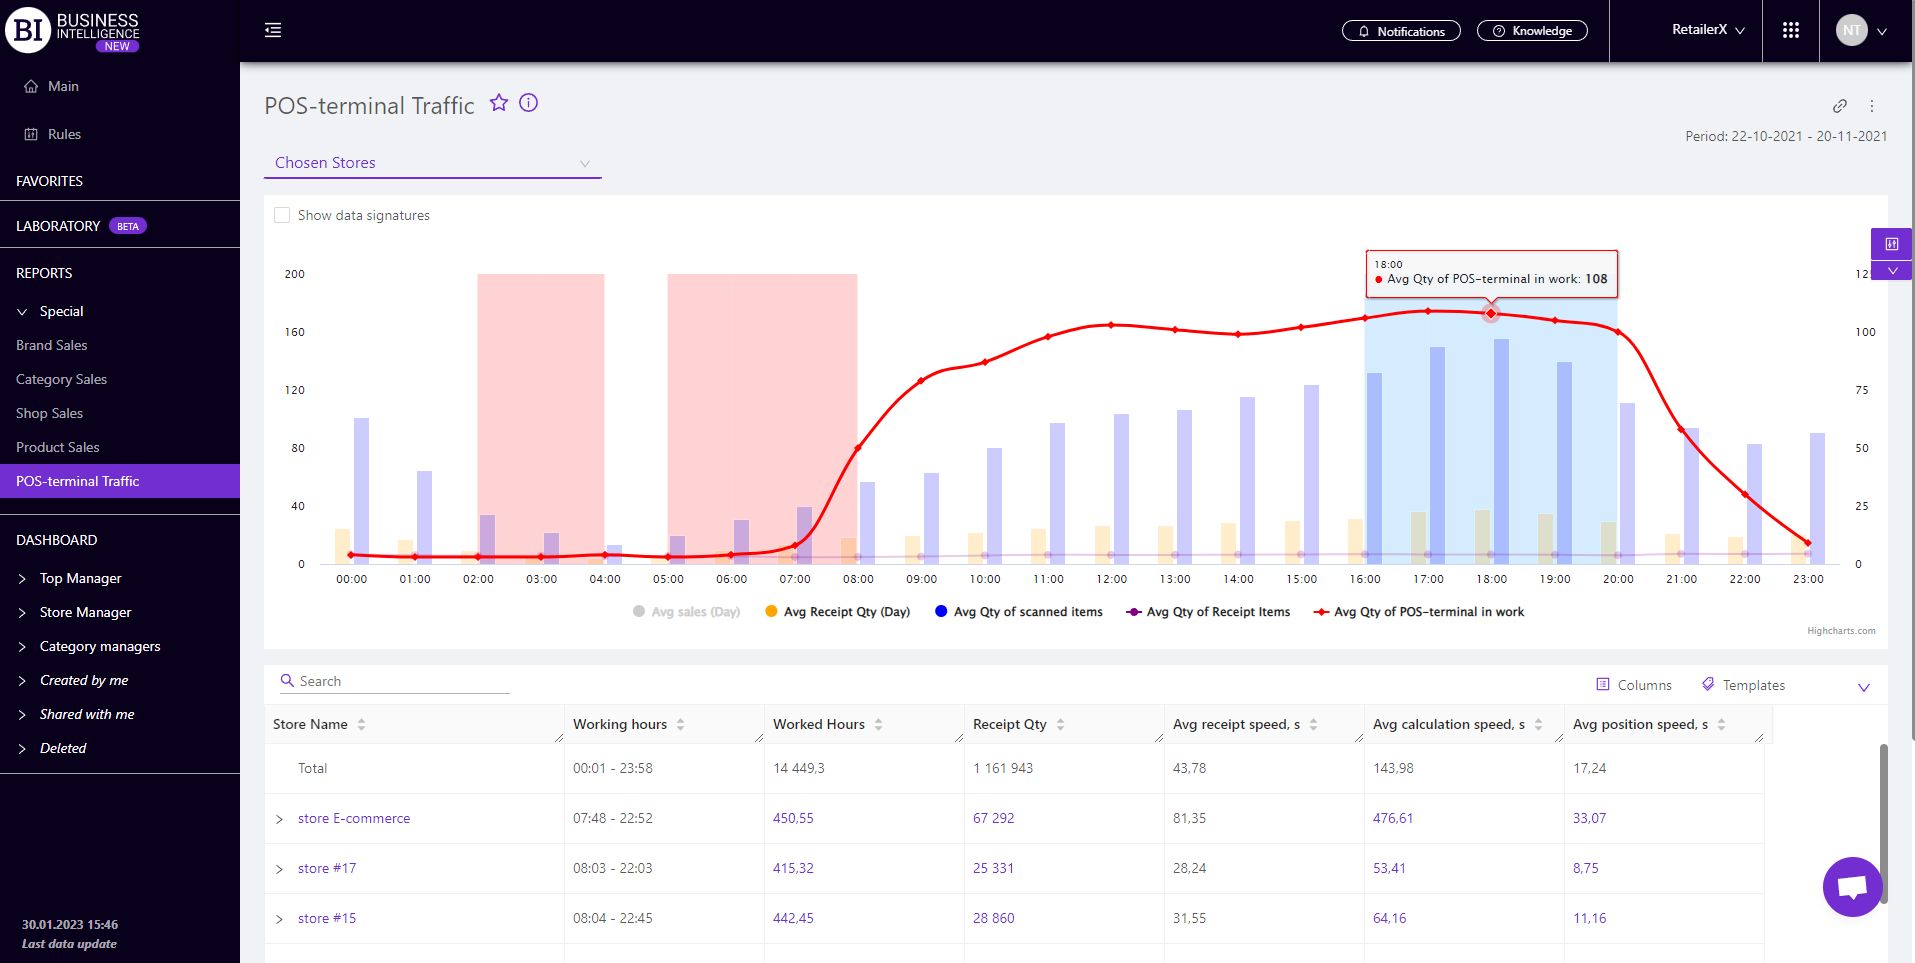
The graph at the top of the report page shows how the following metrics are distributed throughout the day:
- Avg Sales (Day)
- Avg Receipt Qty (Day)
- Avg Qty of scanned items
- Avg Qty of Receipt items
- Avg Qty of POS-terminal in work
To display/hide the metric on the graph you need to use the navigation below it.
The blue area on the graph shows the period of time when a number of opened terminals is not enough. In the future the operation of more terminals during this period must be provided.
The red area shows the period when an excessive number of terminals is opened for inconsiderable sales. In the future it is necessary to reduce the number of operational terminals during this period.
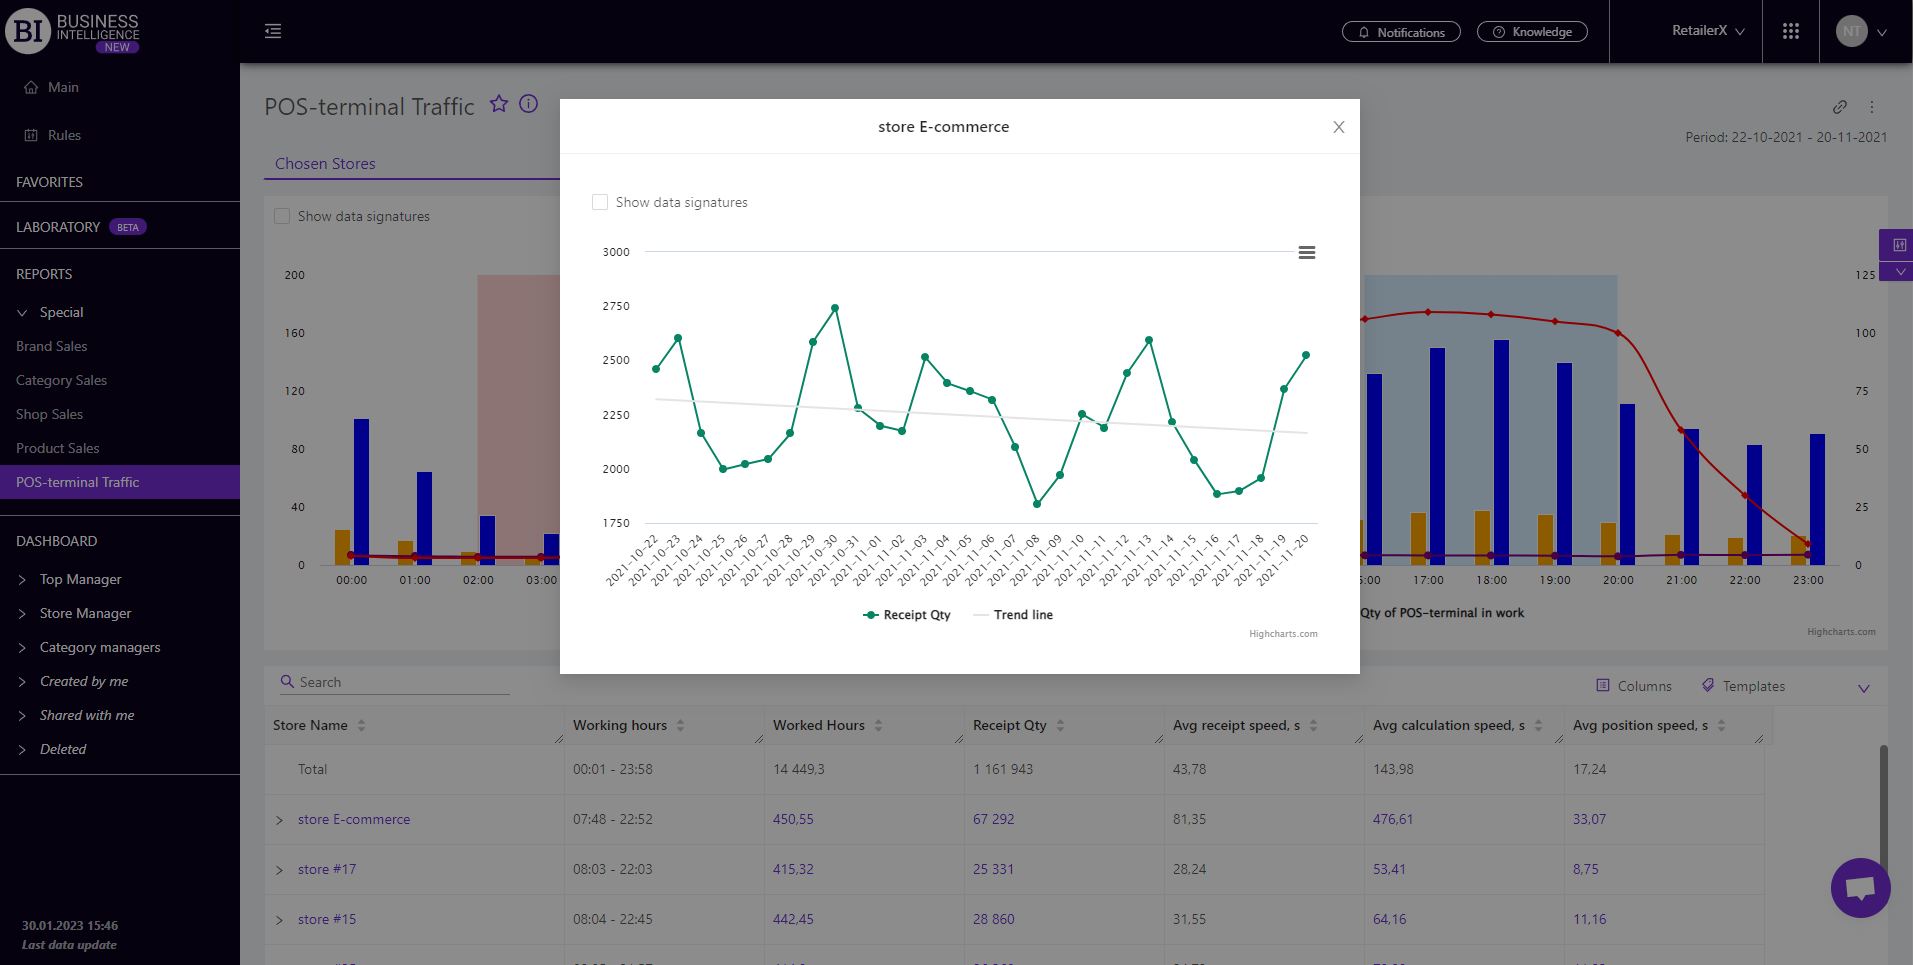
The table of the report summarizes the data on the efficiency of terminals for each store and the chain as a whole.
"Columns" button allows to choose the necessary metrics for generating a report:
- Sales
- Avg sales
- Sales Qty
- Avg Sales Qty
- Receipt Qty
- Avg Receipt Qty
- Avg Receipt Price
- Avg Qty of receipt items
- Avg Qty of scanned items
- Profit
- Qty of days with sales
- Qty of active SKU
- Working hours
- Worked Hours
- Avg receipt speed, s
- Avg position speed, s
- Avg calculation speed, s
"Templates" button - saves the configured report columns as a template.
On the right above the table a context menu is opened where the user can select the following actions:
- "Lock the total row" - fixes the "Total" row in the top row of the table.
- "Save XLS" - saves table data to an xls-file.
- Send XLS" - sends a letter with a table to an xls-file to the entered email address.
To quickly find the terminal you need, enter the first letters/symbols of the terminal name in the search field. The search works automatically, leaving all found matches in the table.
To reset the search results, you must click on the cross in the search field.
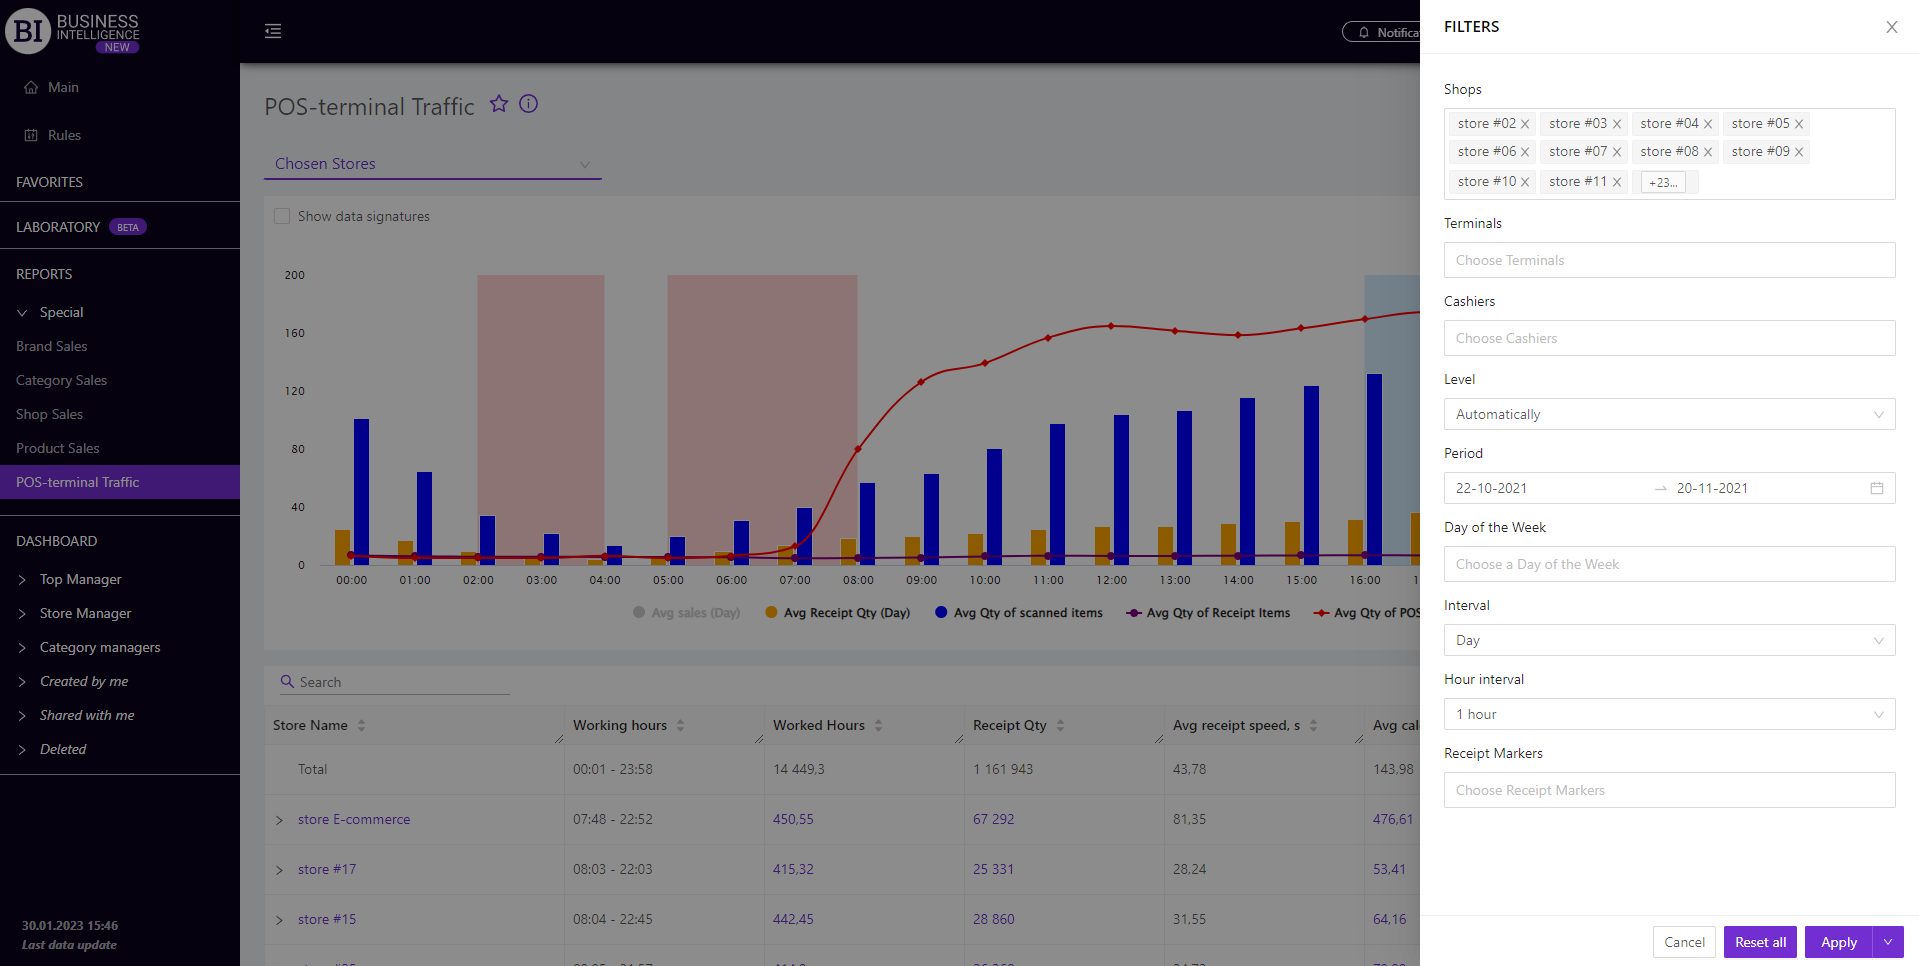
Filters
The selection of filters makes it possible to carry out the analysis within the specified conditions.
Filters button is placed on the right side above the report. Clicking on it opens a modal window with the following filters:
- Stores
- Terminals
- Cashiers
- Level
- Period
- Day of the week
- Interval
- Hour Interval
- Receipt markers