Sections
Basket AnalysisQuadrant analysisProducers analysisStore cardProduct CardBrand salesPlanogram EfficiencyLost SalesSuppliers salesCategories salesCategory managersStores salesSales ChangeCategory CardMarkers comparisonProducts salesUnsaleable productsPrediction of OoS24-Hour AnalysisProducts movementEffectiveness of сashiersProducts for adjustmentPOS-terminal TrafficSales PlansNew SKUEffectiveness of Loyalty ProgramPromo CardStatistic of Loyalty ProgramCustomer Loyalty SegmentationLoyalty CardComparative DynamicsReceiptsStock MonitoringMainPromotion AnalysisRFM - analysisEFFECTIVENESS OF LOYALTY PROGRAM
Reports on Datawiz BI service
The "Effectiveness of Loyalty Program" report summarizes the key metrics of the loyalty program and shows their % in total chain sales.
It contains two tabs: Report and LP Dynamics.

Report
The "Report" tab contains basic information on chain sales and LP % in them. Its functionality allows to:
- view the required data for two periods: "Chosen" and "Previous", comparing them with each other;
- analyze data at different levels, going from the highest (stores) to the lowest (SKU). If the stores are divided into regions, the analysis can be performed in terms of regions, going down to the stores, categories, and products;
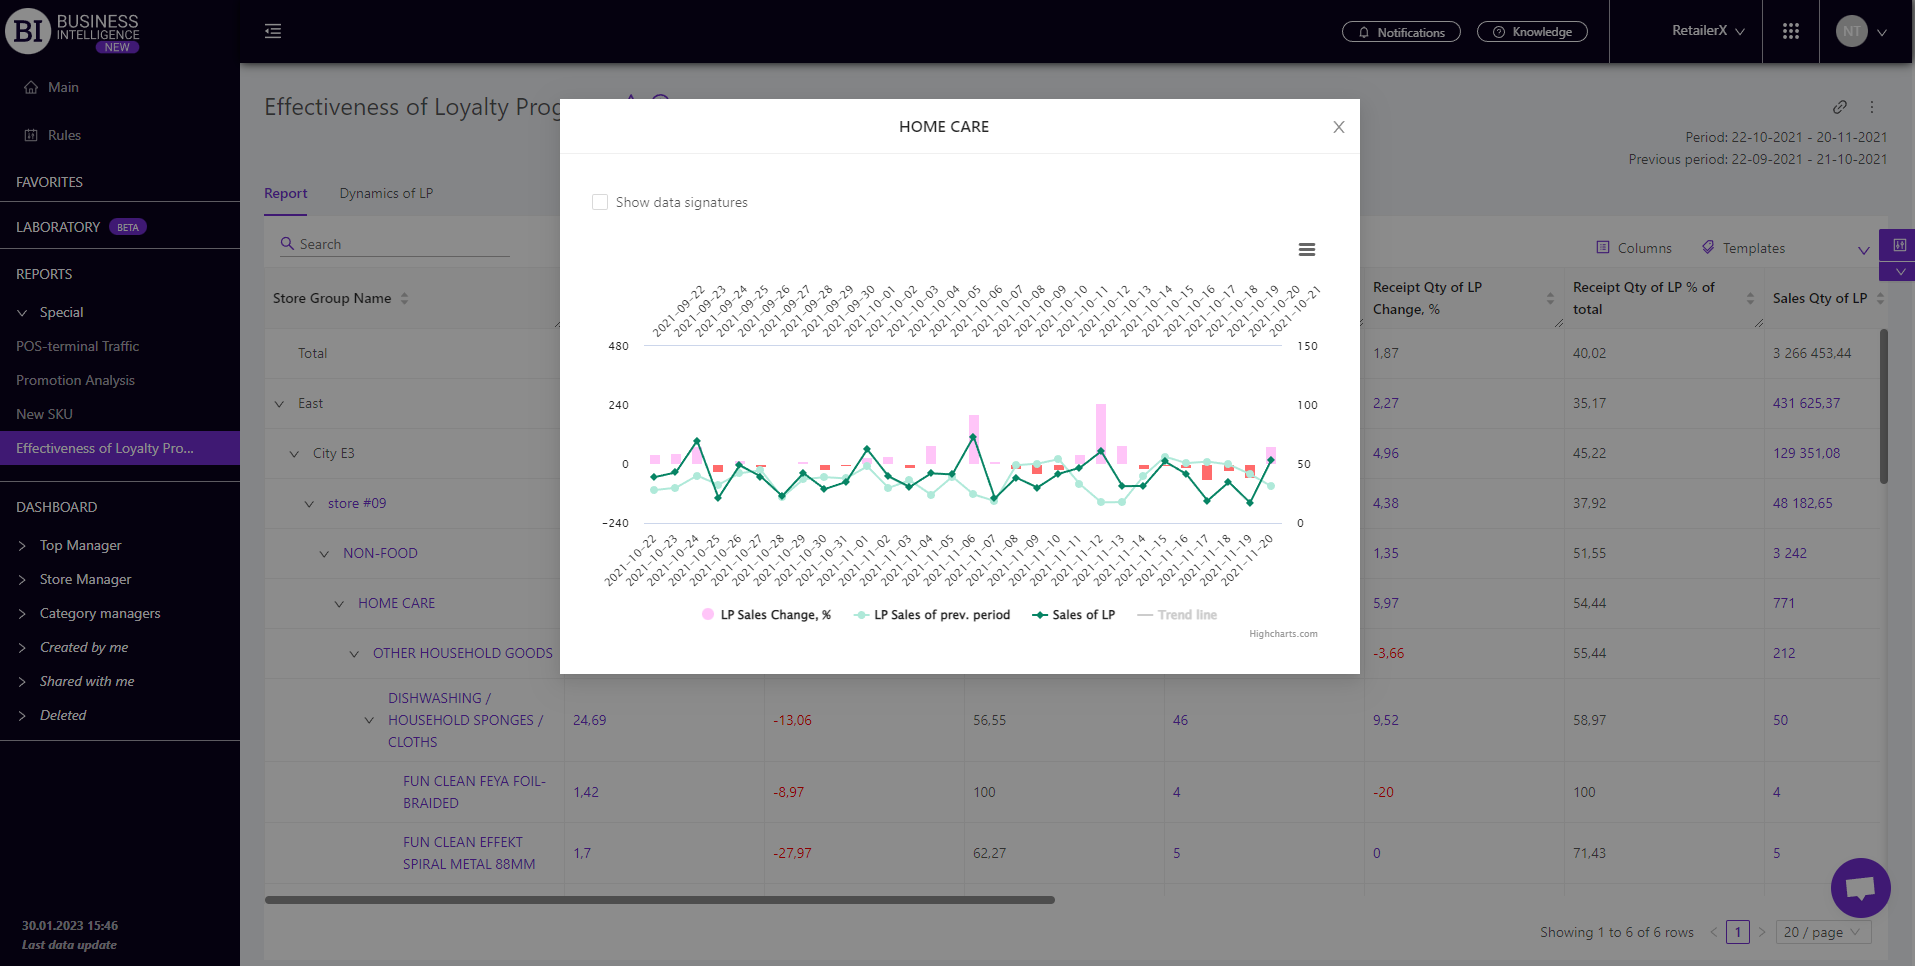
- visually monitor the dynamics of key metrics;
- evaluate the effectiveness of marketing activities in working with LP clients.
LP Dynamics
The "LP Dynamics" tab displays a visualization of the dynamics of LP metrics in comparison with similar chain metrics. When building a graph, you can choose:
- Metrics - the left field above the visualization which allows to choose one of the following metrics from the pop-up list:
To choose the required pair of metrics (LP and chain) it is enough to mark the required metric with a flag.
- Interval - the right field above the visualization which allows to set one of the proposed intervals:
- Day/Month/Year
- Month/Year
- Year
- Month
- Week
- Day of the Week
- Hours
Tick the checkbox Show Data Signatures (on the left above the visualization) to display the values of metrics.

Metrics
"Columns" button allows to choose the necessary metrics for generating a report. All metrics are divided into subgroups:
Sales
- Sales
- Sales Change
- Sales Change, %
- Sales of LP
- LP Sales Change
- LP Sales Change, %
- LP Sales % of total
- Sales of new LP clients
- Sales of new LP clients Change
- Sales of new LP clients Change, %
- % of new LP clients in Sales
Profit
- Profit
- Profit Change
- Profit Change, %
- Profit of LP
- Profit of LP Change
- Profit of LP Change, %
- Profit of LP % of total
- Profit of new LP clients
- Profit of new LP clients Change
- Profit of new LP clients Change, %
- % of new PL clients in Profit
Receipt Qty
- Receipt Qty
- Receipt Qty Change
- Receipt Qty Change, %
- Receipt Qty of LP
- Receipt Qty of LP Change
- Receipt Qty of LP Change, %
- Receipt Qty of LP % of total
- Receipts Qty of new LP clients
- Receipts Qty of new LP clients Change
- Receipts Qty of new LP clients Change, %
- % receipts qty of new LP clients in Receipts Qty
Sales Qty
- Sales Qty
- Sales Qty Change
- Sales Qty Change, %
- Sales Qty of LP
- Sales Qty of LP Change
- Sales Qty of LP Change, %
- Sales Qty of LP % of total
- Sales Qty of new LP clients
- Sales Qty of new LP clients Change
- Sales Qty of new LP clients Change, %
- % of Sales Qty of new LP clients
Avg Receipt Price
- Avg Receipt Price
- Avg Receipt Price Change
- Avg Receipt Price Change, %
- Avg Receipt Price of LP
- Avg Receipt Price of LP Change
- Avg Receipt Price of LP Change, %
- Avg Receipt Price of new LP clients
- Avg Receipt Price of new LP clients Change
- Avg Receipt Price of new LP clients Change, %
Assortment activity
Note! Access to viewing metrics according to the user's role is determined by the administrator. Contact your administrator to expand the access.
Metrics highlighted in purple or red are clickable. Clicking on them opens a window with a flow chart of the chosen metric.
"Templates" button - saves the configured report columns as a template.
On the right above the table a context menu is opened where the user can select the following actions:
- "Lock the total row" - fixes the "Total" row in the top row of the table.
- "Save XLS" - saves table data to an xls-file.
- Send XLS" - sends a letter with a table to an xls-file to the entered email address.
To quickly find the necessary dimension (stores, categories, products), enter the first letters/symbols of the unit name in the search field. The search works automatically, leaving all found matches in the table.
To reset the search results, click on the cross in the search field.

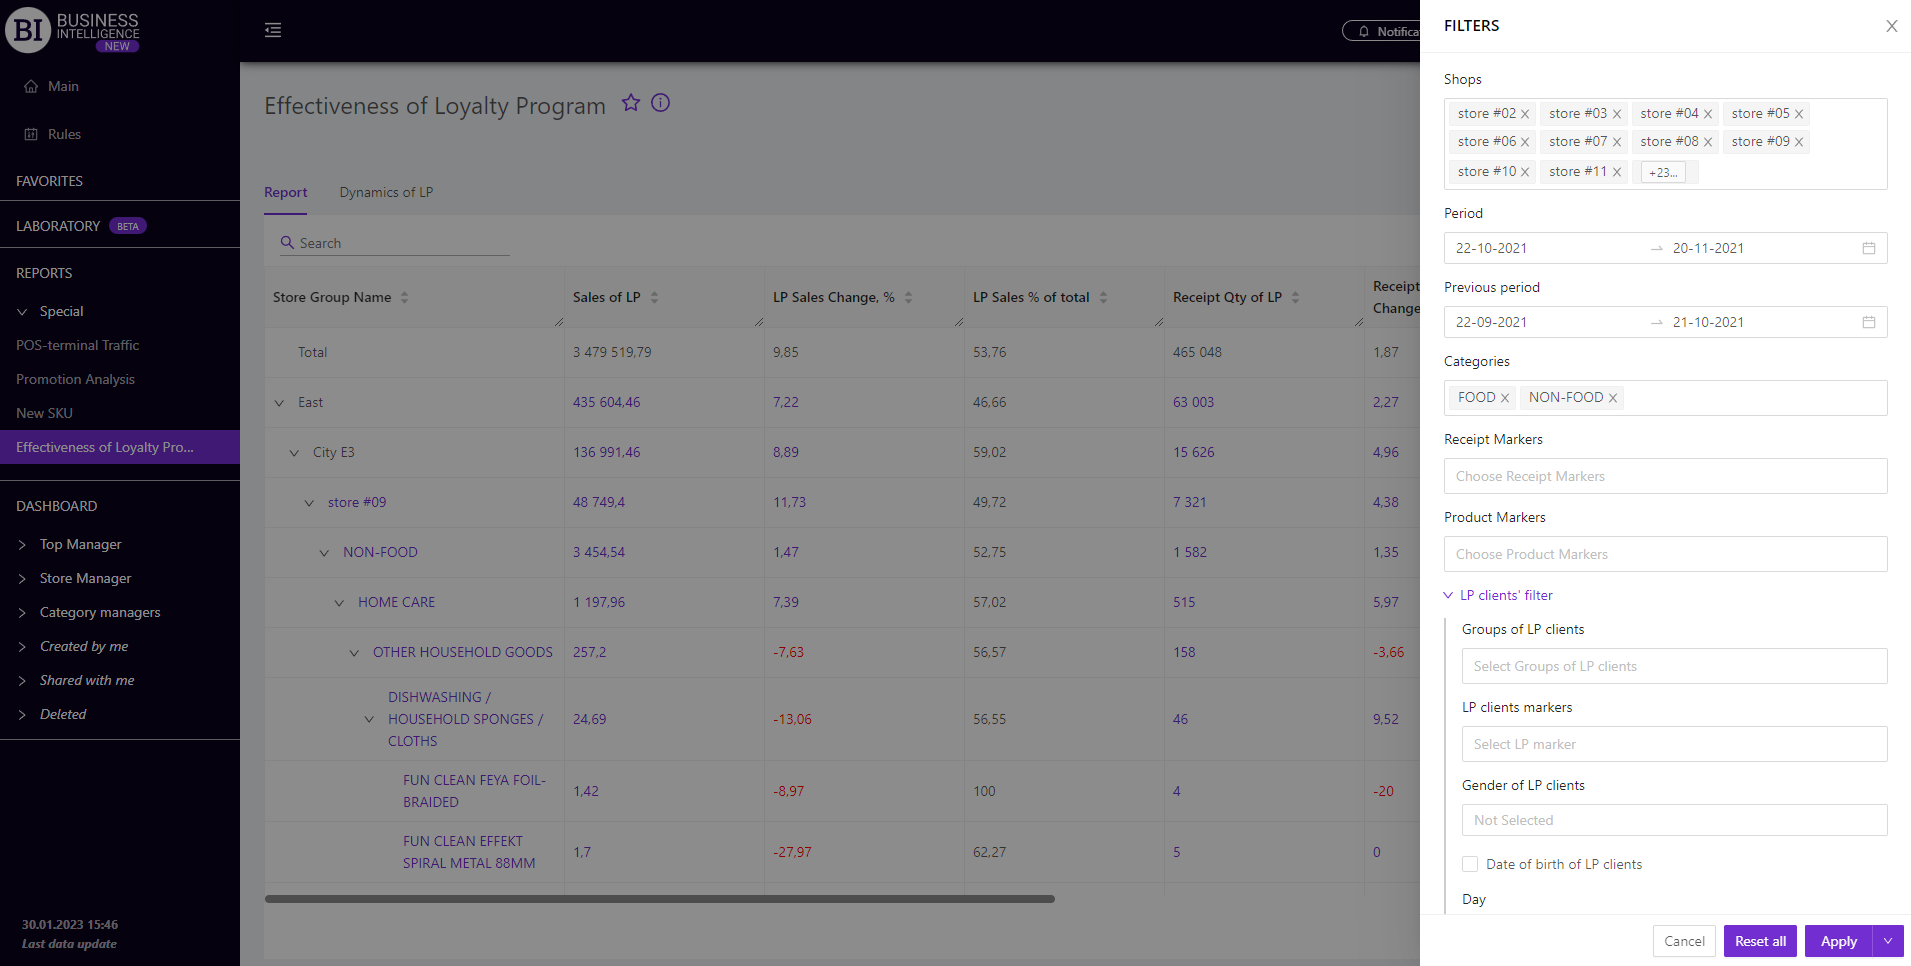
Filters
The selection of filters makes it possible to carry out the analysis within the specified conditions.
Filters button is placed on the right side above the report. Clicking on it opens a modal window with the following filters:
- Stores
- Period
- Previous period
- Categories
- Receipt markers
- Product markers
- LP Clients’ filter