Sections
Basket AnalysisQuadrant analysisProducers analysisStore cardProduct CardBrand salesPlanogram EfficiencyLost SalesSuppliers salesCategories salesCategory managersStores salesSales ChangeCategory CardMarkers comparisonProducts salesUnsaleable productsPrediction of OoS24-Hour AnalysisProducts movementEffectiveness of сashiersProducts for adjustmentPOS-terminal TrafficSales PlansNew SKUEffectiveness of Loyalty ProgramPromo CardStatistic of Loyalty ProgramCustomer Loyalty SegmentationLoyalty CardComparative DynamicsReceiptsStock MonitoringMainPromotion AnalysisRFM - analysisPRODUCTS FOR ADJUSTMENT
Reports on Datawiz BI service
The "Products for adjustment" report contains data on products stocks of which should be adjusted.
The report includes products that were not sold for three or more days consecutively in the selected period and were on the stocks at this time.
The functionality of the report allows to:
- identify products that need to be checked for their actual stocks;
- find out the period when the inaccurate stocks of products were appeared;
- compare visualizations of sales and products stocks to identify incorrect stocks.
The report is formed for each store separately and for the chain as a whole. To choose a store, click on 'Chosen stores" field on the left above the table and choose the necessary store from the pop-up list.
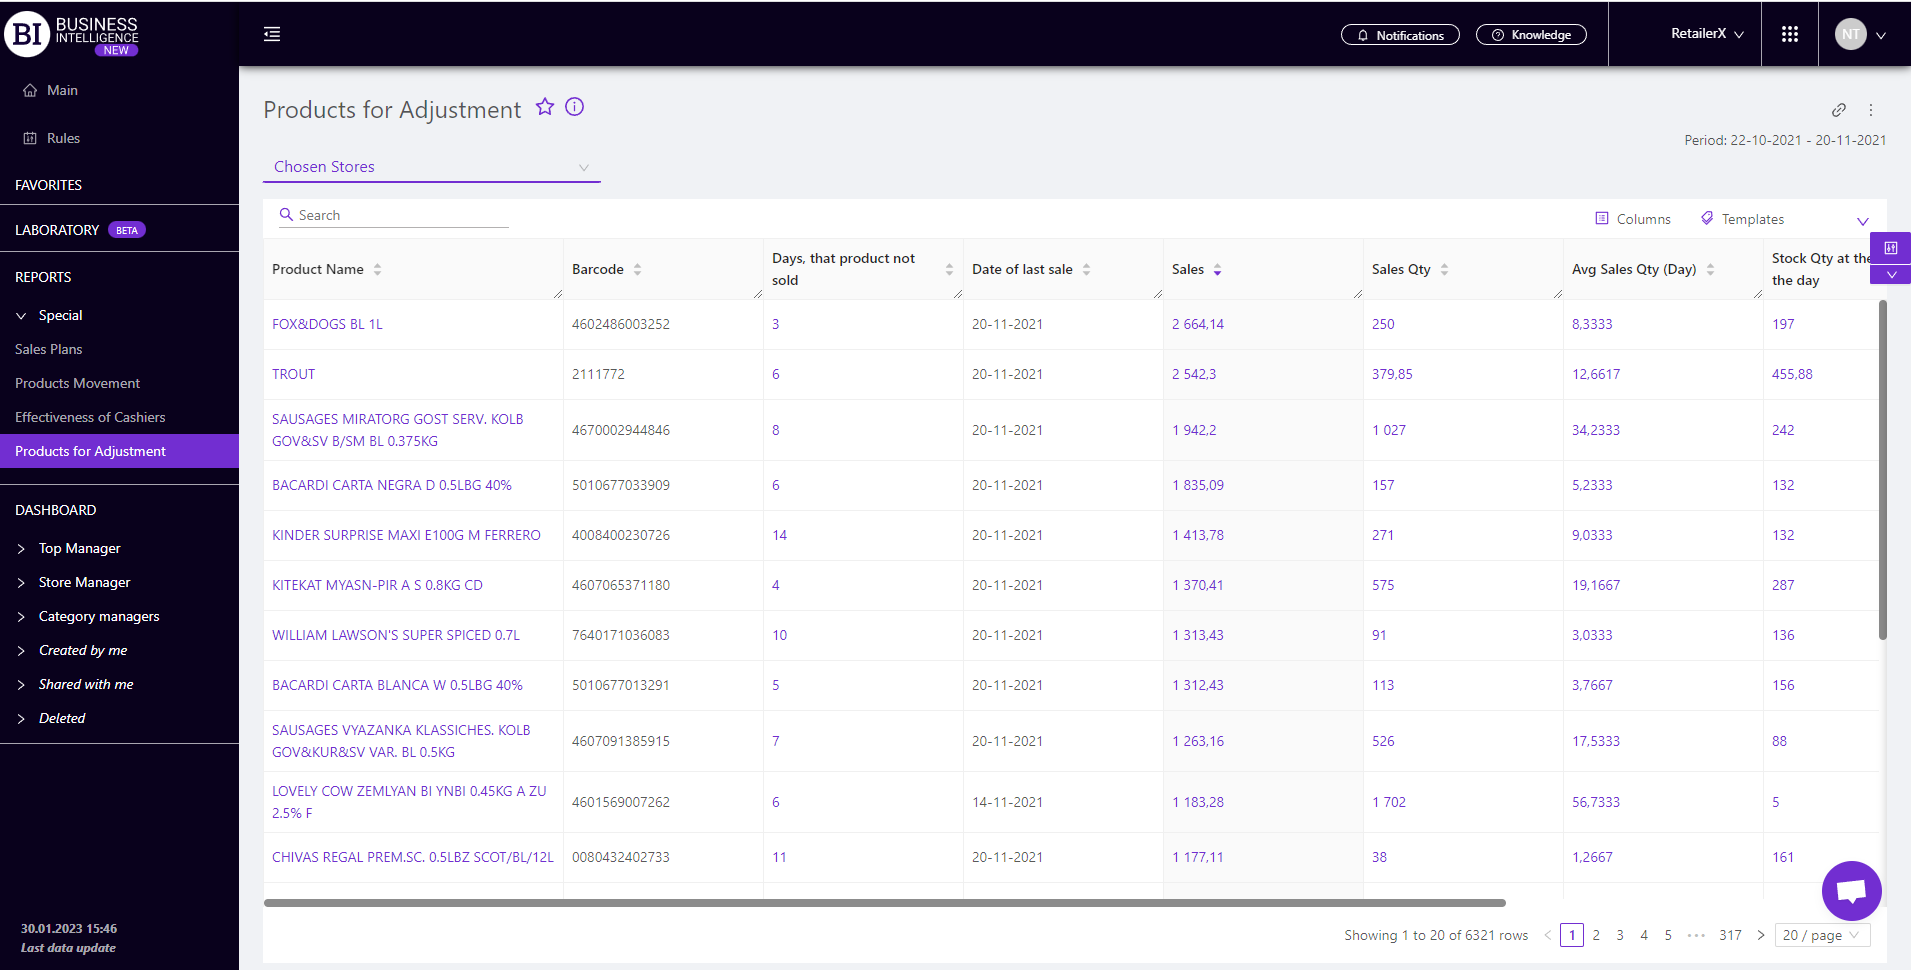
Metrics
"Columns" button allows to choose the necessary metrics for generating a report:
- Sales
- Sales Qty
- Avg Sales Qty
- Stock Qty at the end of the day
- Stock Qty at the beginning of the day
- Days, that product not sold
- Date of last sale
- Identifier
- Barcode
Metrics highlighted in purple and red are clickable. Clicking on them opens a window with a flow chart of the chosen metric.
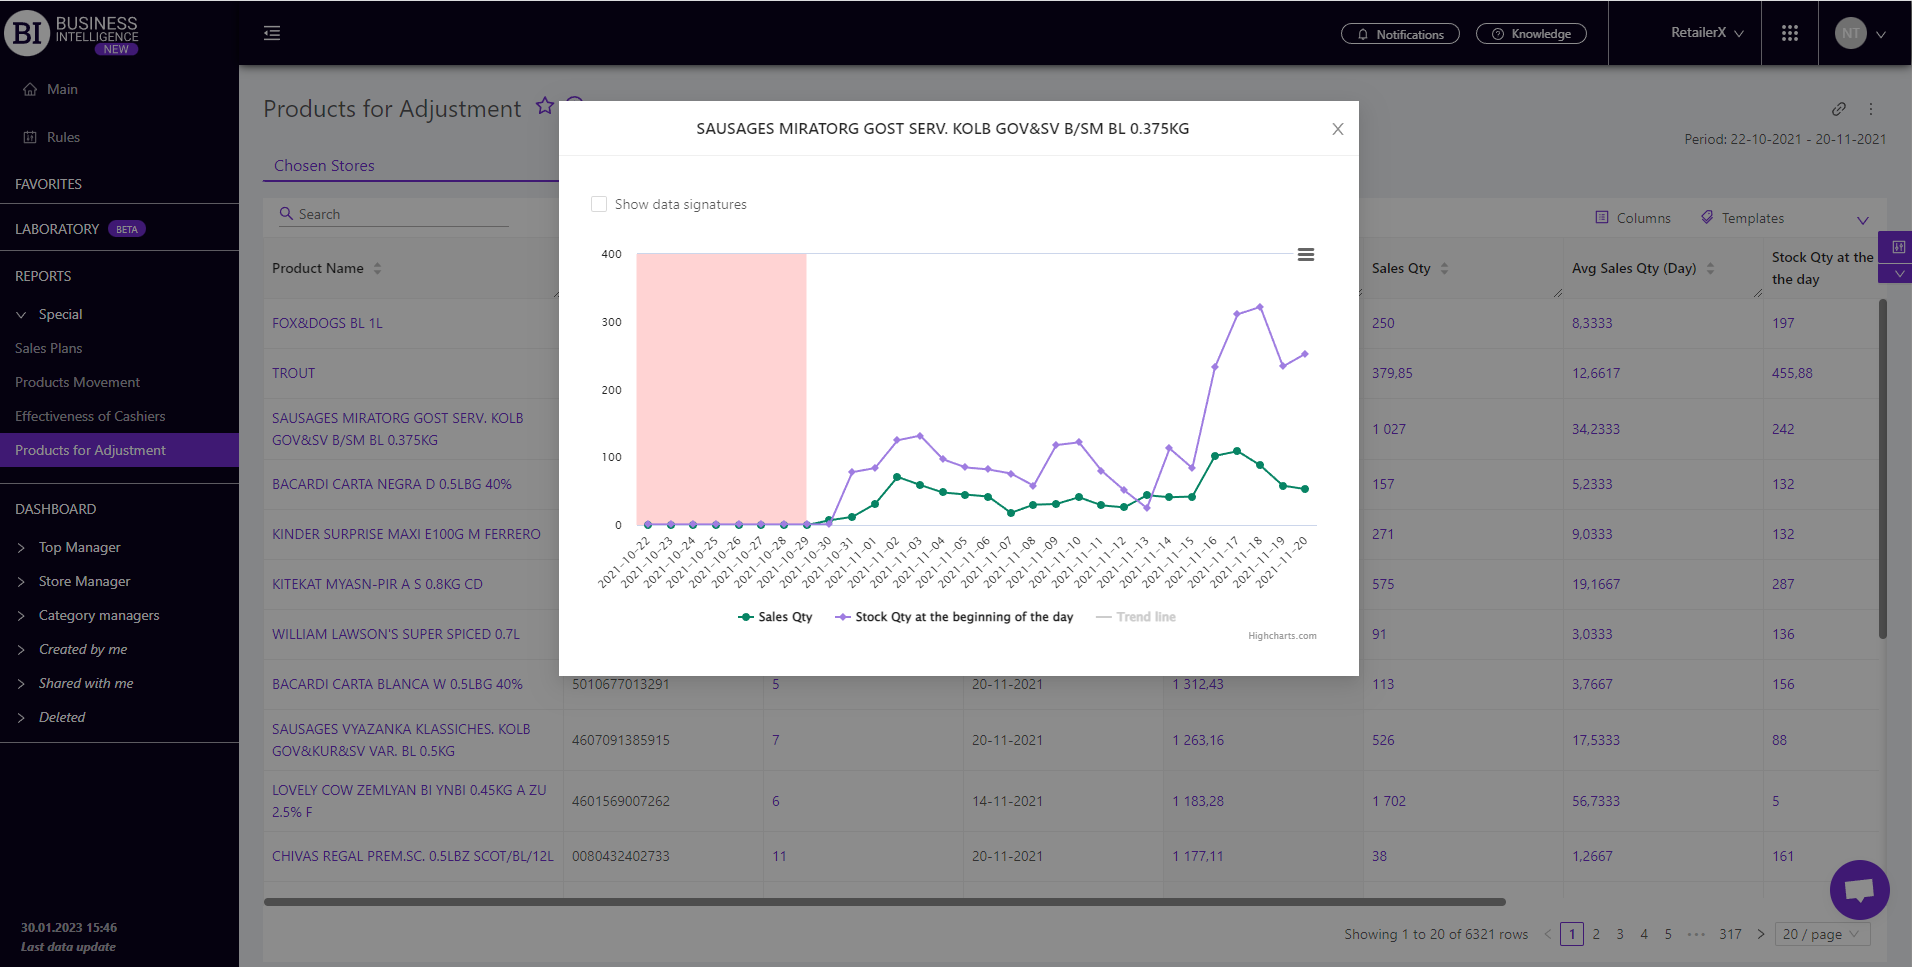
Clicking on the report on the indicators such as "Sales Qty" or "Stocks Qty at the beginning of the day" opens their joint visualization. The area highlighted in red is a signal that they need to be recalculated to identify the causes of inaccurate residues.
"Templates" button - saves the configured report columns as a template.
On the right above the table a context menu is opened where the user can select the following actions:
- "Save XLS" - saves table data to an xls-file.
To quickly find the products you need, enter the first letters/symbols of the product name in the search field. The search works automatically, leaving all found matches in the table.
To reset the search results you must click on the cross in the search field.
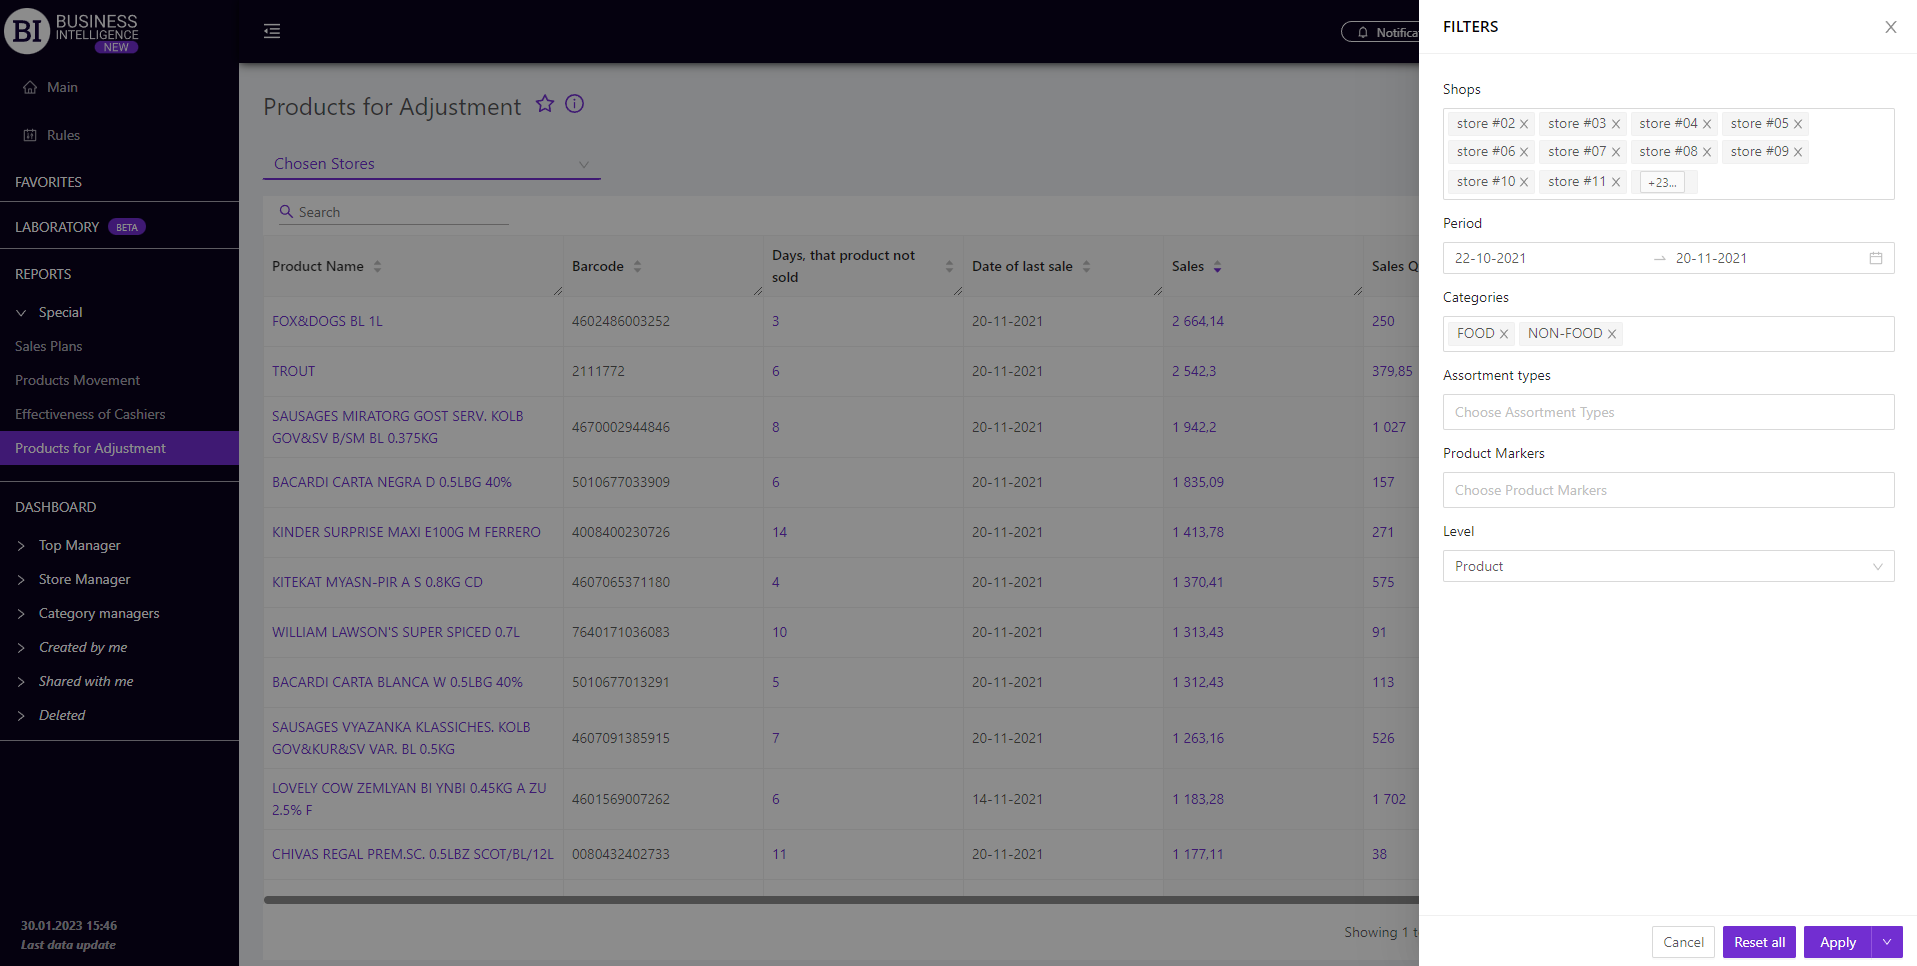
Filters
The selection of filters makes it possible to carry out the analysis within the specified conditions.
Filters button is placed on the right side above the report. Clicking on it opens a modal window with the following filters:
- Stores
- Period
- Categories
- Assortment Types
- Product Markers
- Level