Sections
Basket AnalysisQuadrant analysisProducers analysisStore cardProduct CardBrand salesPlanogram EfficiencyLost SalesSuppliers salesCategories salesCategory managersStores salesSales ChangeCategory CardMarkers comparisonProducts salesUnsaleable productsPrediction of OoS24-Hour AnalysisProducts movementEffectiveness of сashiersProducts for adjustmentPOS-terminal TrafficSales PlansNew SKUEffectiveness of Loyalty ProgramPromo CardStatistic of Loyalty ProgramCustomer Loyalty SegmentationLoyalty CardComparative DynamicsReceiptsStock MonitoringMainPromotion AnalysisRFM - analysisMAIN
Reports on Datawiz BI service
The Main Page of the solution shows the results of the chain and allows to view the main metrics:
- for the last day of available data on the solution;
- for the last week;
- for the last month (30 days);
- for the last 90 days.
To change the time interval click on the necessary tab at the top of the page.
There is the number of stores in the upper right corner of the page for chosen data (according to the access rights granted).
The analytics and metrics of the Main Page are different for the following types of roles:
- Owner / Other;
- Store Manager;
- Cashier / Category Manager;
- Marketer;
- IT Specialist.
The Main Page is conventionally divided into the following blocks:
- key metrics cards;
- interactive visualizations with sales metrics;
- useful articles and case studies using solution reports.
Key Metrics Cards
A quick overview of the main sales metrics is provided by their information cards placed at the top of the page.
Each Metric Card contains:
- the actual metric value;
- the period it is generated for;
- percentage change compared to the same previous period.
A green up arrow indicates an increase, and a red down arrow indicates a decrease.
Note! Access to viewing information according to the role of the user is determined by the administrator. Contact your administrator to expand access.
Interactive Visualizations
For the “Owner” and “Top Manager” roles there are visualization blocks with general information about network activity located on the Main page from which you can instantly go to reports for more detailed analysis.
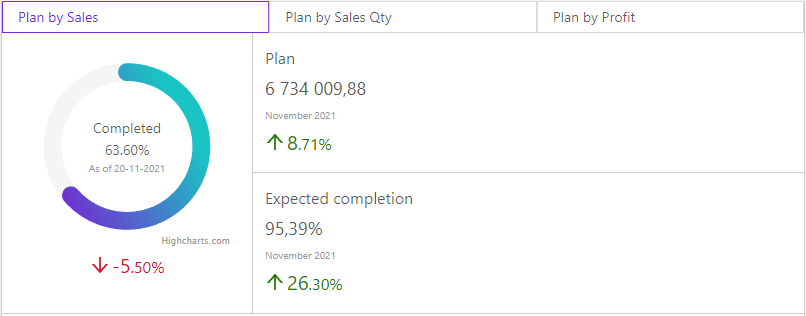
The block with metrics of plans realization and their changes in metrics Sales, Sales Qty, and Profit consists of:
- circular graph of the plan completing as of the date of the last data uploading;
- plan for the chosen metric for the current month;
- expected plan realization.
To select the desired metric you must use the tabs at the top of the block.
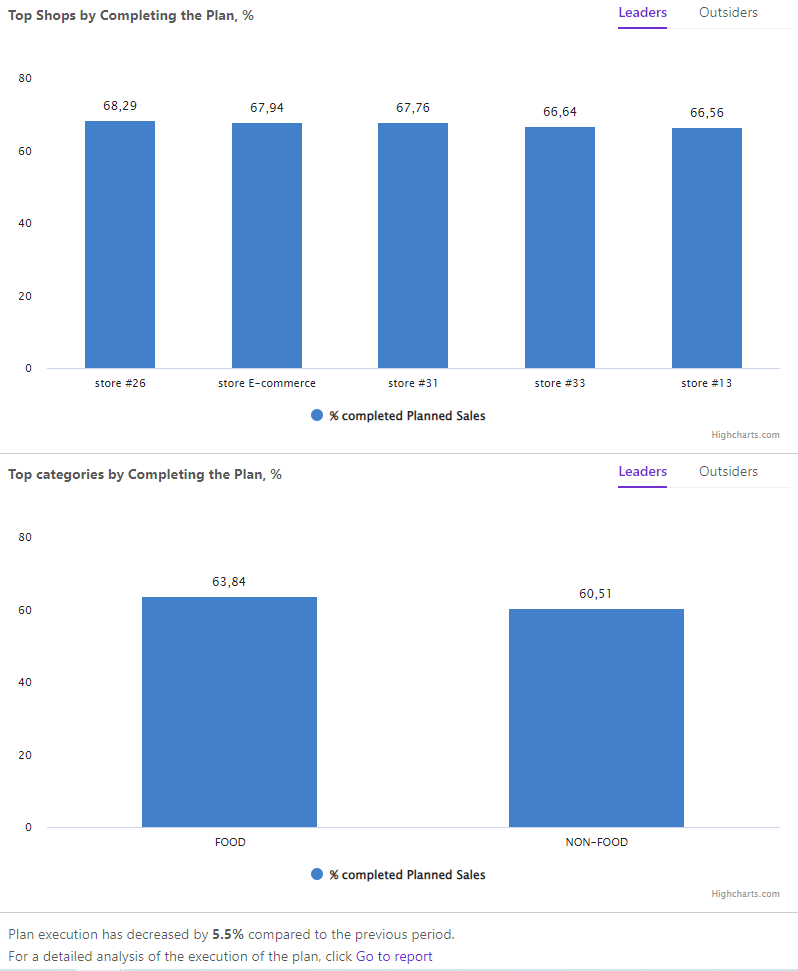
The block also contains the column graph "Top Stores by Completing the Plan, %" and "Top categories by Completing the Plan, %" with two tabs "Leaders" and "Outsiders", showing the stores with the highest and lowest values % completed Planned Sales respectively. To go to the desired rating click on the corresponding tab.
For a more detailed analysis at the end of the block there is a hyperlink to the Sales Plans report and the percentage of the plan change compared to the previous period.
Next to it there is a block with the column graph "Top stores by Sales Change" and "Top categories by Sales Change" which display data according to the metrics Sales % Change, Receipt Qty % Change, Profit % Change and contain the tabs "Leaders" and "Outsiders".
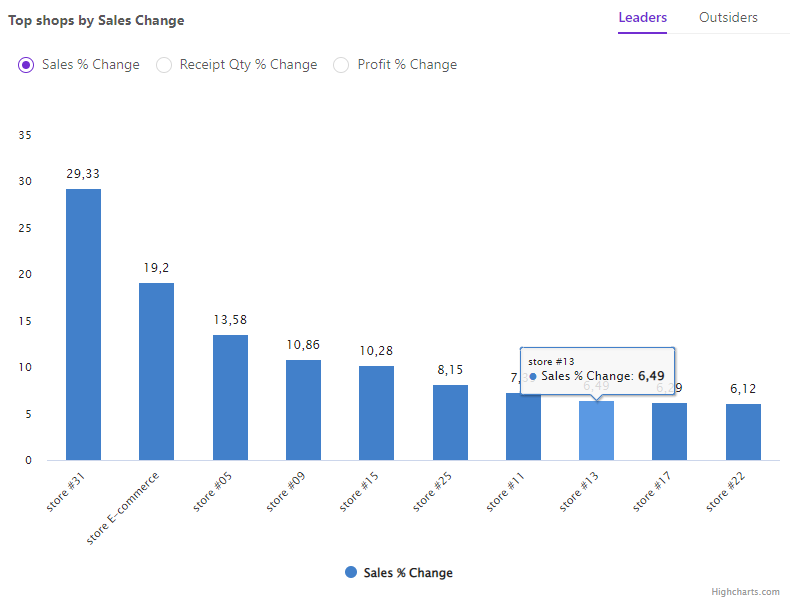
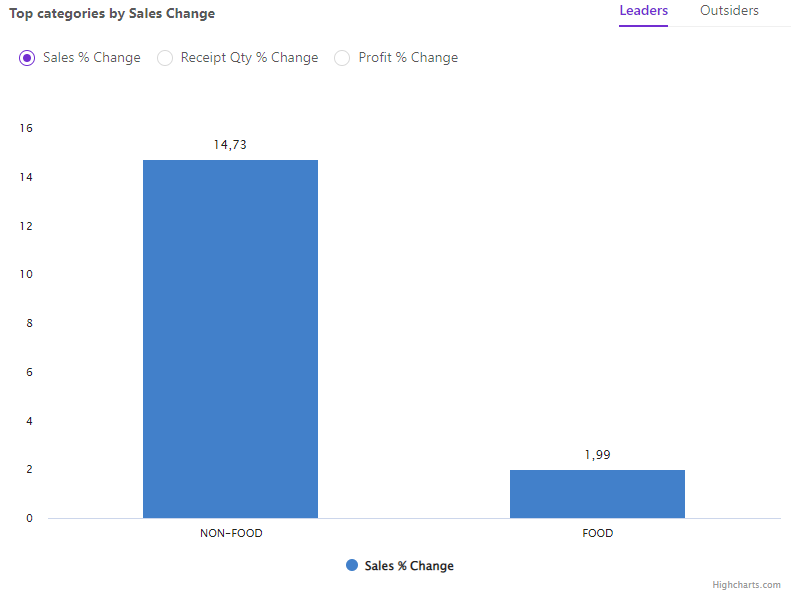
At the end of the block the total change of each metric compared to the previous period and a hyperlink to the report "Store Sales" are indicated.

The block "New SKU Analysis" contains a table with metrics of Sales and Sales Qty in which the list of products changes depending on the transition to the "Leaders" and "Outsiders" tabs and the column graph "Top Sales SKUs" which displays the top stores by sales of new SKUs from higher to lower values.
At the beginning of the block it is indicated how much the Assortment of products has expanded, the Sales of new SKUs for the selected period and a hyperlink to the "New SKU" report is indicated.

Next to it there is the Promotional Products Statistics block which contains information cards with actual values and percentage changes of metrics: Promo active SKU Qty, Promoted product Sales, % of Sales of Promo products - and the column graph “% of Sales of Promo products” which displays data in the store's section and contains the Leaders and Outsiders tabs.
At the beginning of the block there is the number of promos found, and their percentage of the total profit for the selected period is indicated, as well as hyperlink to the Promotion Analysis.

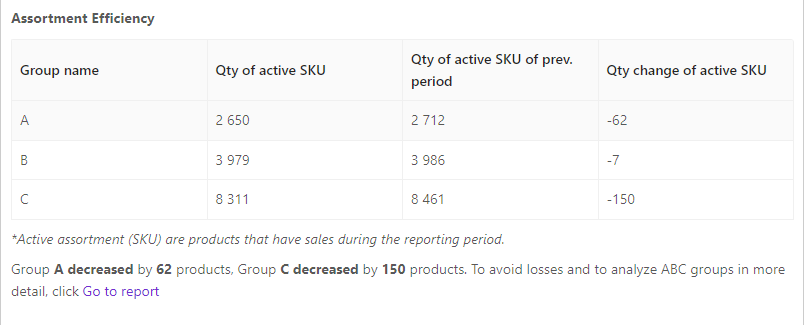
The block "Assortment Efficiency" contains a table with product groups A, B, C and metrics: Qty of active SKU, Qty of active SKU for the prev. period, and Qty change of active SKU.
Under the table it is indicated how much the number of products in the groups has decreased/increased for the selected period in comparison with the previous period, and a hyperlink to the report "Product Sales" is also indicated.
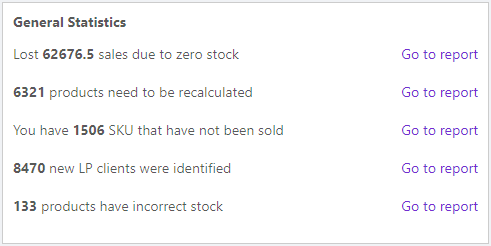
“General Statistics” block collects general information for the selected period:
- the qty of lost sales due to zero stock with a hyperlink to the Lost Sales report;
- the qty of products to be recalculated, with a hyperlink to the Products for Adjustment report;
- the qty of SKUs that have not been sold, with a hyperlink to the Unsaleable Products report;
- the qty of identified new LP clients with a hyperlink to the Statistic of Loyalty Program report;
- the qty of products that have incorrect stock, with a hyperlink to the Stock Monitoring report.
For "Store Manager", "Cashier", "Category Manager" role types there are three visualizations on the Main Page: "Top-10 Products by Sale Change" and "Plans Realization".
"Top-10 Products by Sale Change" visualization - a column graph which shows the product ranking by key sales metrics.
Activate the checkbox next to the necessary metric to change the metric on the visualization.
The "Leaders" and "Outsiders" tabs display 10 products with the highest and lowest rates.
Below there is a block with the metrics of plans completion and their change in: Sales, Sales Qty, Profit. It consists of:
- circular graph of the plan as of the date of the last data uploading;
- plan for the chosen metric for the current month;
- expected plan realization.
The block includes a column graph of "Top-5 Categories by Plan Realization" with two tabs on the left - "Leaders" and "Outsiders". Tabs display 5 categories with the highest and lowest values of plan realization %.
Note! Use the tabs at the top of the block to choose the necessary metric.
For "Marketer" role type there are two interactive visualizations on the Main Page: "Top-5 Stores with Promotional Products Sales Share" and "Top-5 Sales Promotions".
"Top-5 Stores with Promotional Products Sales Share" visualization - a chart which shows the stores ranking by key metrics of promotional products sales. Visualization compares the promotional products share with the overall store sales: Sales, Profit, Receipt Qty.
Activate the checkbox next to the necessary metric to change the metric on the visualization.
The "Leaders" and "Outsiders" tabs display 5 stores with the highest and lowest rates.
"Top-5 Sales Promotions" visualization - a column chart which shows the promotions rating by key sales metrics: Sales, Profit, Receipt Qty.
The "Leaders" and "Outsiders" tabs display 5 promotions with the highest and lowest rates.
For the "IT Specialist" role type there is "Sales Dynamic" visualization on the Main Page displays. It summarizes the main metrics of sales by stores, or for the period. Use the tabs in the upper right corner - "By Store" and "For the Period" to change the display of metrics on the visualization.
Navigation under the visualization allows to display or hide metrics on it.
Statistics of problem products
The block "Statistics of problem products" displays information about all identified problems in stores, statistics of their occurrence and resolution.
You can also analyze this information on the Store, Category and Product Cards.
Statistics are collected from the mobile application Store Manager.
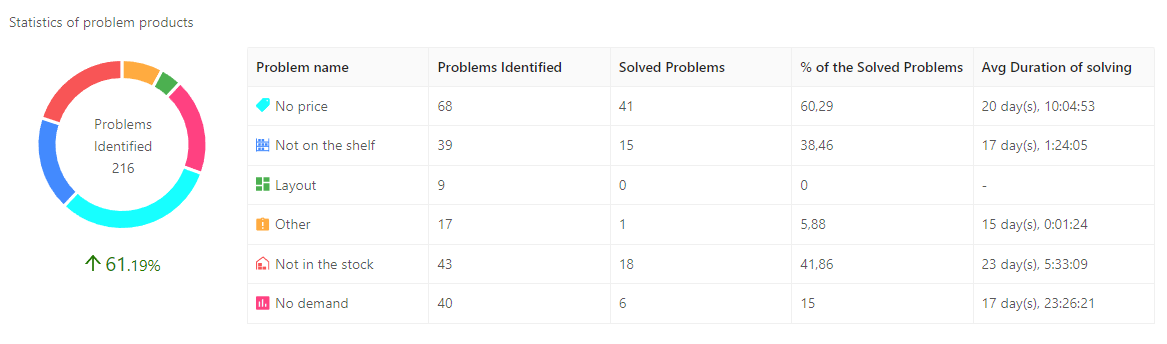
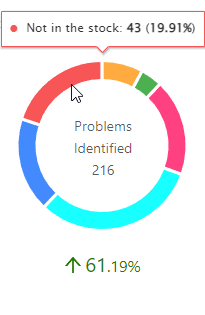
Circular visualization
The pie chart shows the quantity of problems detected on the date of the last data download. Visualization is divided into blocks according to the color of problems from the mobile application Store Manager:
- No price
- Not on the shelf
- Layout
- Other
- Not in the stock
- No demand
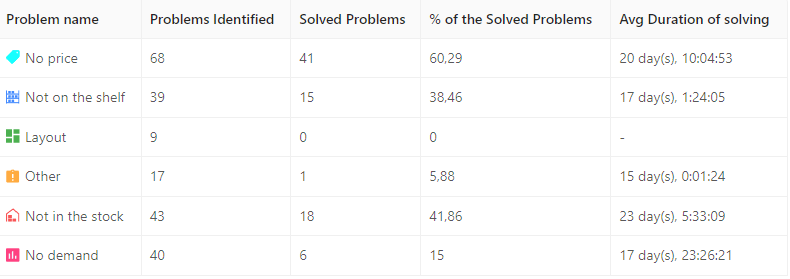
Table
The table contains the names of problems:
- No price
- Not on the shelf
- Layout
- Other
- Not in the stock
- No demand
Metrics:
Note! The problem products block is displayed for the following types of roles:
- Owner
- Store manager
- Category manager
- Analyst
- Regional manager
- Top Manager