Sections
Basket AnalysisQuadrant analysisProducers analysisStore cardProduct CardBrand salesPlanogram EfficiencyLost SalesSuppliers salesCategories salesCategory managersStores salesSales ChangeCategory CardMarkers comparisonProducts salesUnsaleable productsPrediction of OoS24-Hour AnalysisProducts movementEffectiveness of сashiersProducts for adjustmentPOS-terminal TrafficSales PlansNew SKUEffectiveness of Loyalty ProgramPromo CardStatistic of Loyalty ProgramCustomer Loyalty SegmentationLoyalty CardComparative DynamicsReceiptsStock MonitoringMainPromotion AnalysisRFM - analysisLOST SALES
Reports on Datawiz BI service
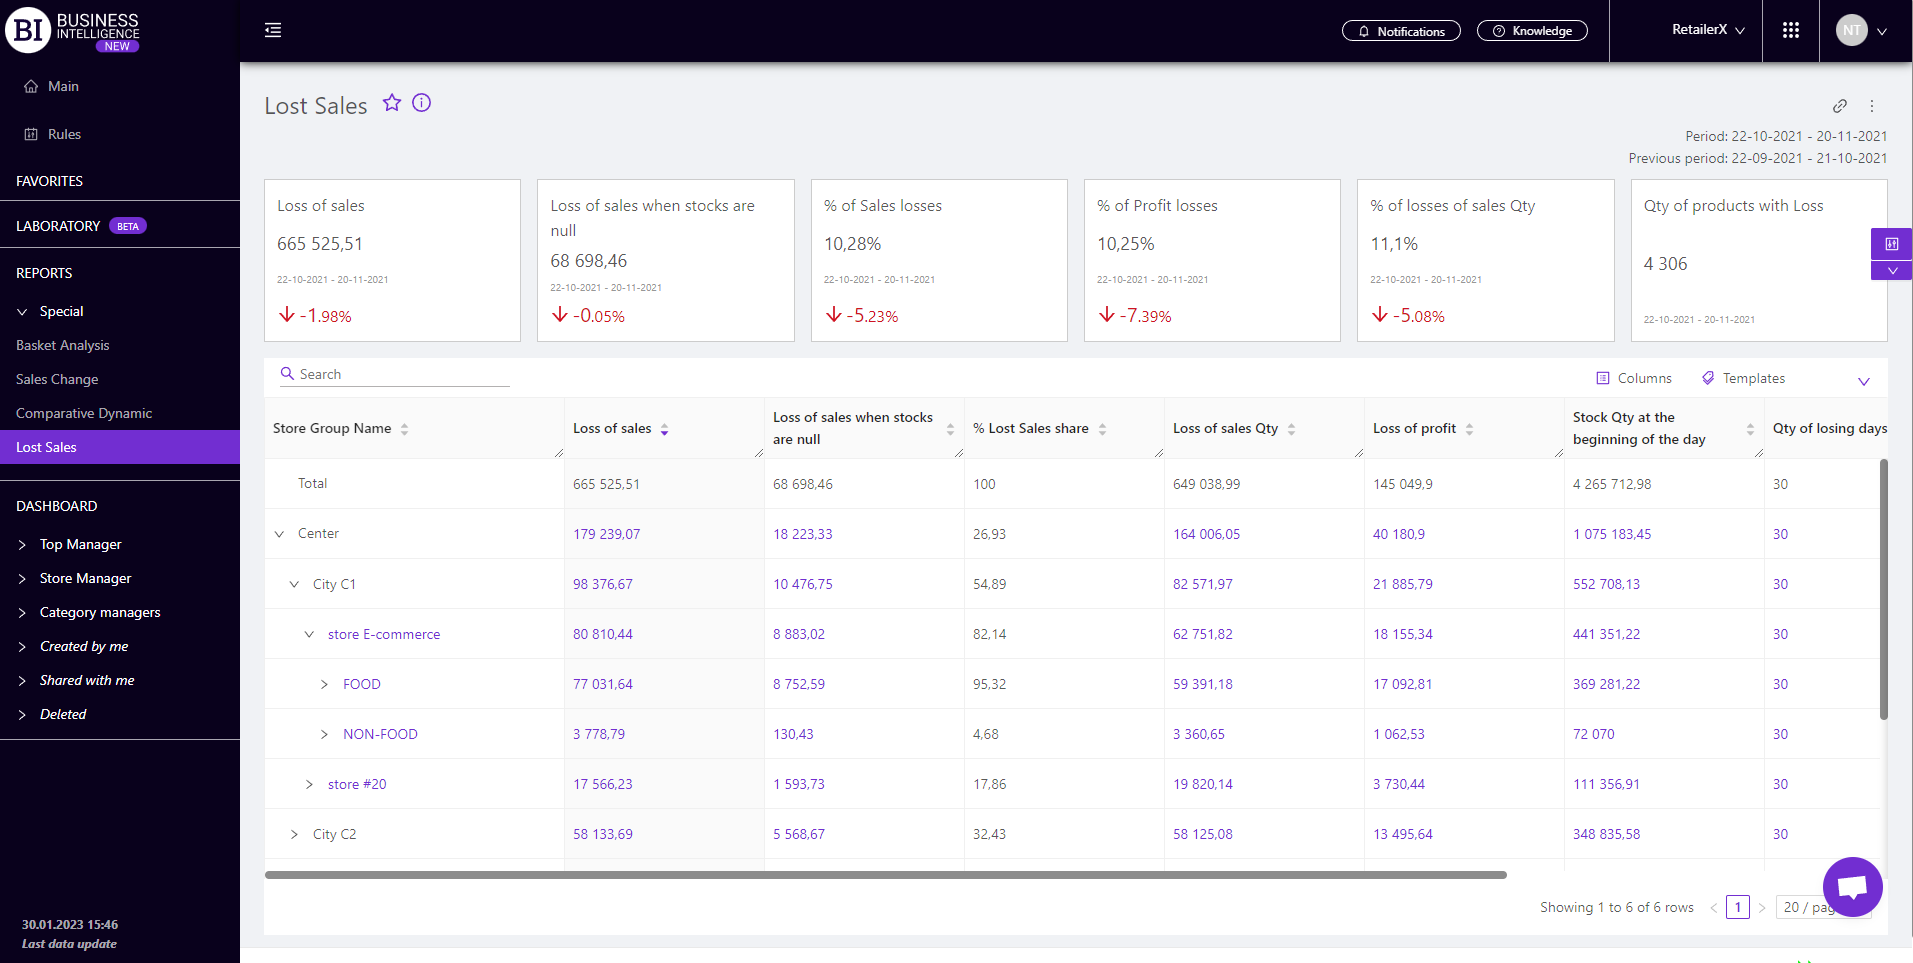
The "Lost Sales" report summarizes data of losses due to missing or low sales.
The functionality of the report allows:
- to identify lost sales by products, categories, stores, category managers;
- to determine the amount of losses, including due to zero balances;
- to track the dynamics of sales and balances on problem products;
- to identify the causes of losses, problem areas at work and avoid them in the future.
The report includes items that have sales or stocks. In addition, the products are checked for asymmetry in the distribution of sales dynamics. Thus, only those with symmetrical (uniform) sales dynamics are displayed in the report.
Metrics
"Columns" button allows to choose the necessary metrics for generating a report. All metrics are divided into the following subgroups:
Metrics highlighted in purple and red are clickable. Clicking on them opens a window with a flow chart of the chosen metric.
Note! The visualization of the clickable metric "Qty of losing sales" contains curves of two metrics: Sales Qty and Stock Qty at the beginning of the day. This allows to see losses due to zero or minimal stocks.
Visualization of the clickable metric "Stocks Qty at the beginning of the day" shows a combined graph, which contains the dynamics of metrics: Ordered Product Qty, Received Product Qty and Stock Qty at the beginning of the day.
"Templates" button - saves the configured report columns as a template.
On the right above the table context menu is opened where the user can select the following actions:
- "Lock the total row" - fixes the "Total" row in the top row of the table.
- "Save XLS" - saves table data to an xls file.
To quickly find the necessary product, enter the first letters/symbols of the product name in the search field. The search works automatically, leaving all found matches in the table.
To reset the search results, click on the cross in the search field.
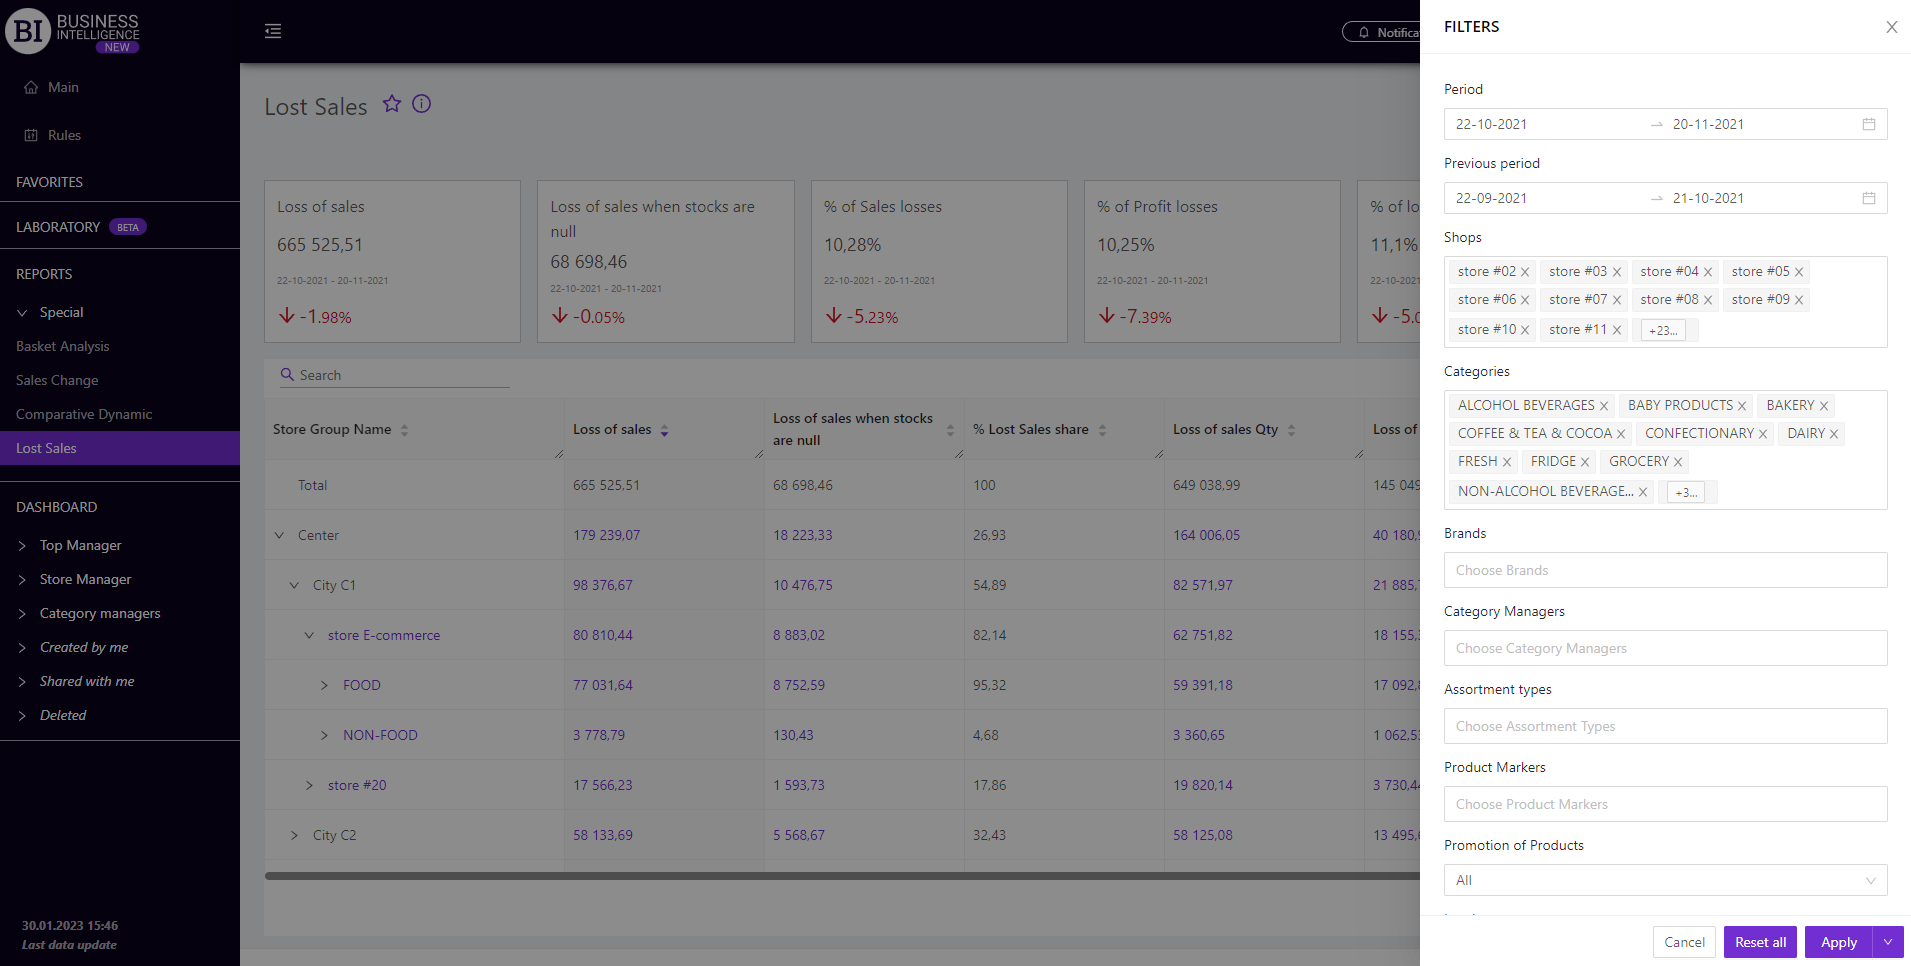
Filters
The selection of filters makes it possible to carry out the analysis within the specified conditions.
Filters button is placed on the right side above the report. Clicking on it opens a modal window with the following filters:
- Stores
- Period
- Previous Period
- Category Managers
- Assortment Types
- Product markers
- Categories
- Brands
- Level
- Promotion of products