Sections
Basket AnalysisQuadrant analysisProducers analysisStore cardProduct CardBrand salesPlanogram EfficiencyLost SalesSuppliers salesCategories salesCategory managersStores salesSales ChangeCategory CardMarkers comparisonProducts salesUnsaleable productsPrediction of OoS24-Hour AnalysisProducts movementEffectiveness of сashiersProducts for adjustmentPOS-terminal TrafficSales PlansNew SKUEffectiveness of Loyalty ProgramPromo CardStatistic of Loyalty ProgramCustomer Loyalty SegmentationLoyalty CardComparative DynamicsReceiptsStock MonitoringMainPromotion AnalysisRFM - analysisSTOCK MONITORING
Reports on Datawiz BI service
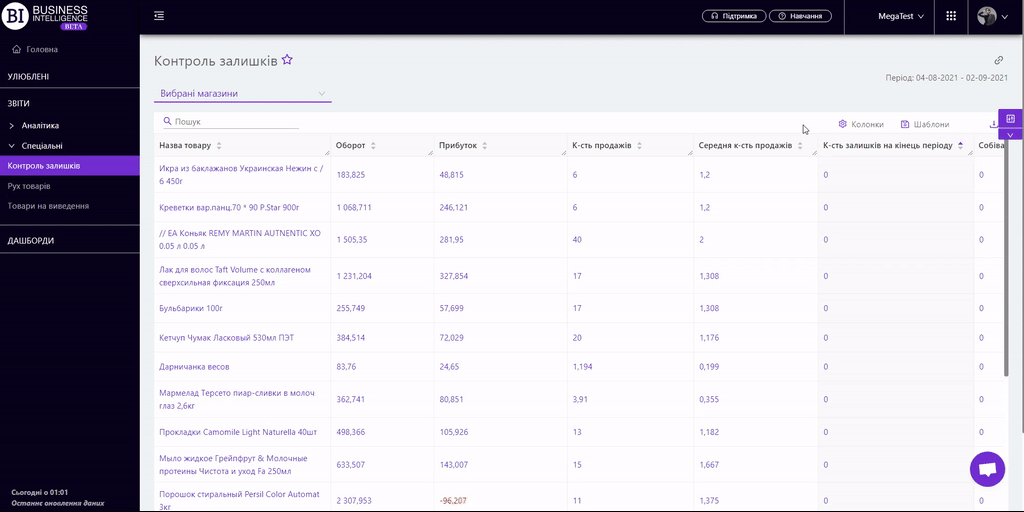
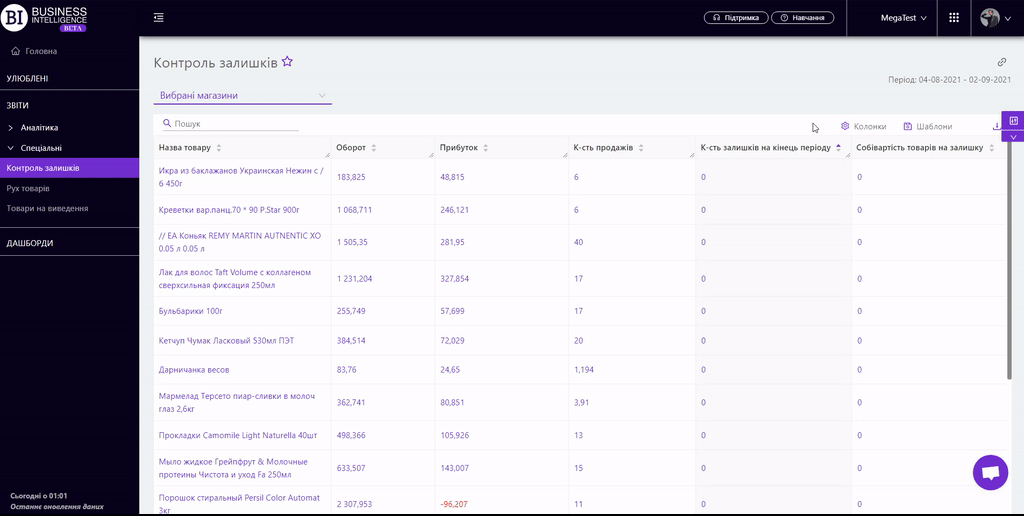
The "Stocks Monitoring" report summarizes data on products that were sold as zero balances at least once during the period. The functionality of the report allows to:
- find products with incorrect balances;
- determine when an error in the data could occur;
- visually track the dynamics of sales and stocks of "problem" products.
The report is formed for each store separately and for the chain as a whole. To choose a store click on "Chosen Stores" field on the left above the table and choose the necessary store from the pop-up list.
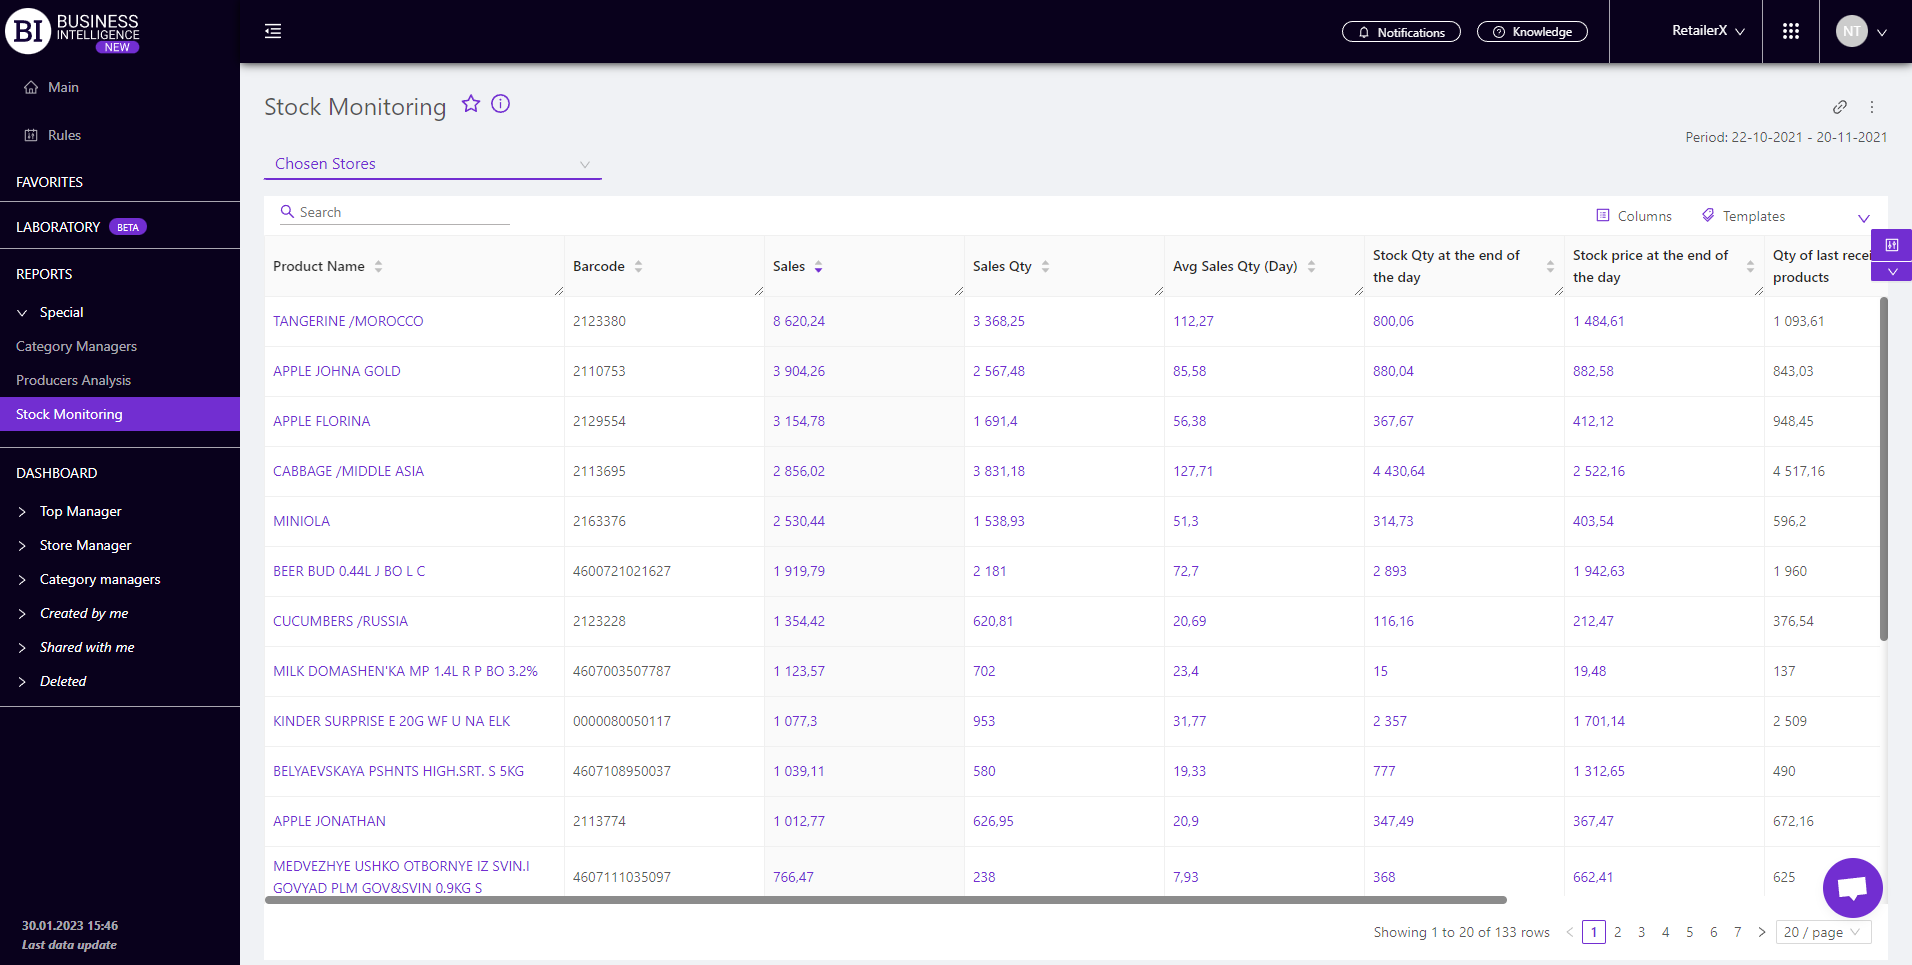
Metrics
"Columns" button allows to choose the necessary metrics for generating a report for the following:
- Sales
- Sales Qty
- Avg Sales Qty
- Stock Qty at the end of the day
- Primecost at the end of the day
- Stock Qty at the beginning of the day
- Stock Price at the beginning of the day
- Profit
- Qty of days with sales and 0 stocks
- Identifier
- Barcode
- Date of the last received product
- Qty of last received products
Note! Access to viewing metrics according to the user's role is determined by the administrator. Contact your administrator to expand the access.
Metrics highlighted in purple or red are clickable. Clicking on them opens a window with a flow chart of the chosen metric.
"Templates" button - saves the configured report columns as a template.
On the right above the table a context menu is opened where the user can select the following actions:
- "Lock the total row" - fixes the "Total" row in the top row of the table.
- "Save XLS" - saves table data to an xls-file.
To quickly find the necessary unit, enter the first letters/symbols of the unit name in the search field. The search works automatically, leaving all found matches in the table.
To reset the search results click on the cross in the search field.
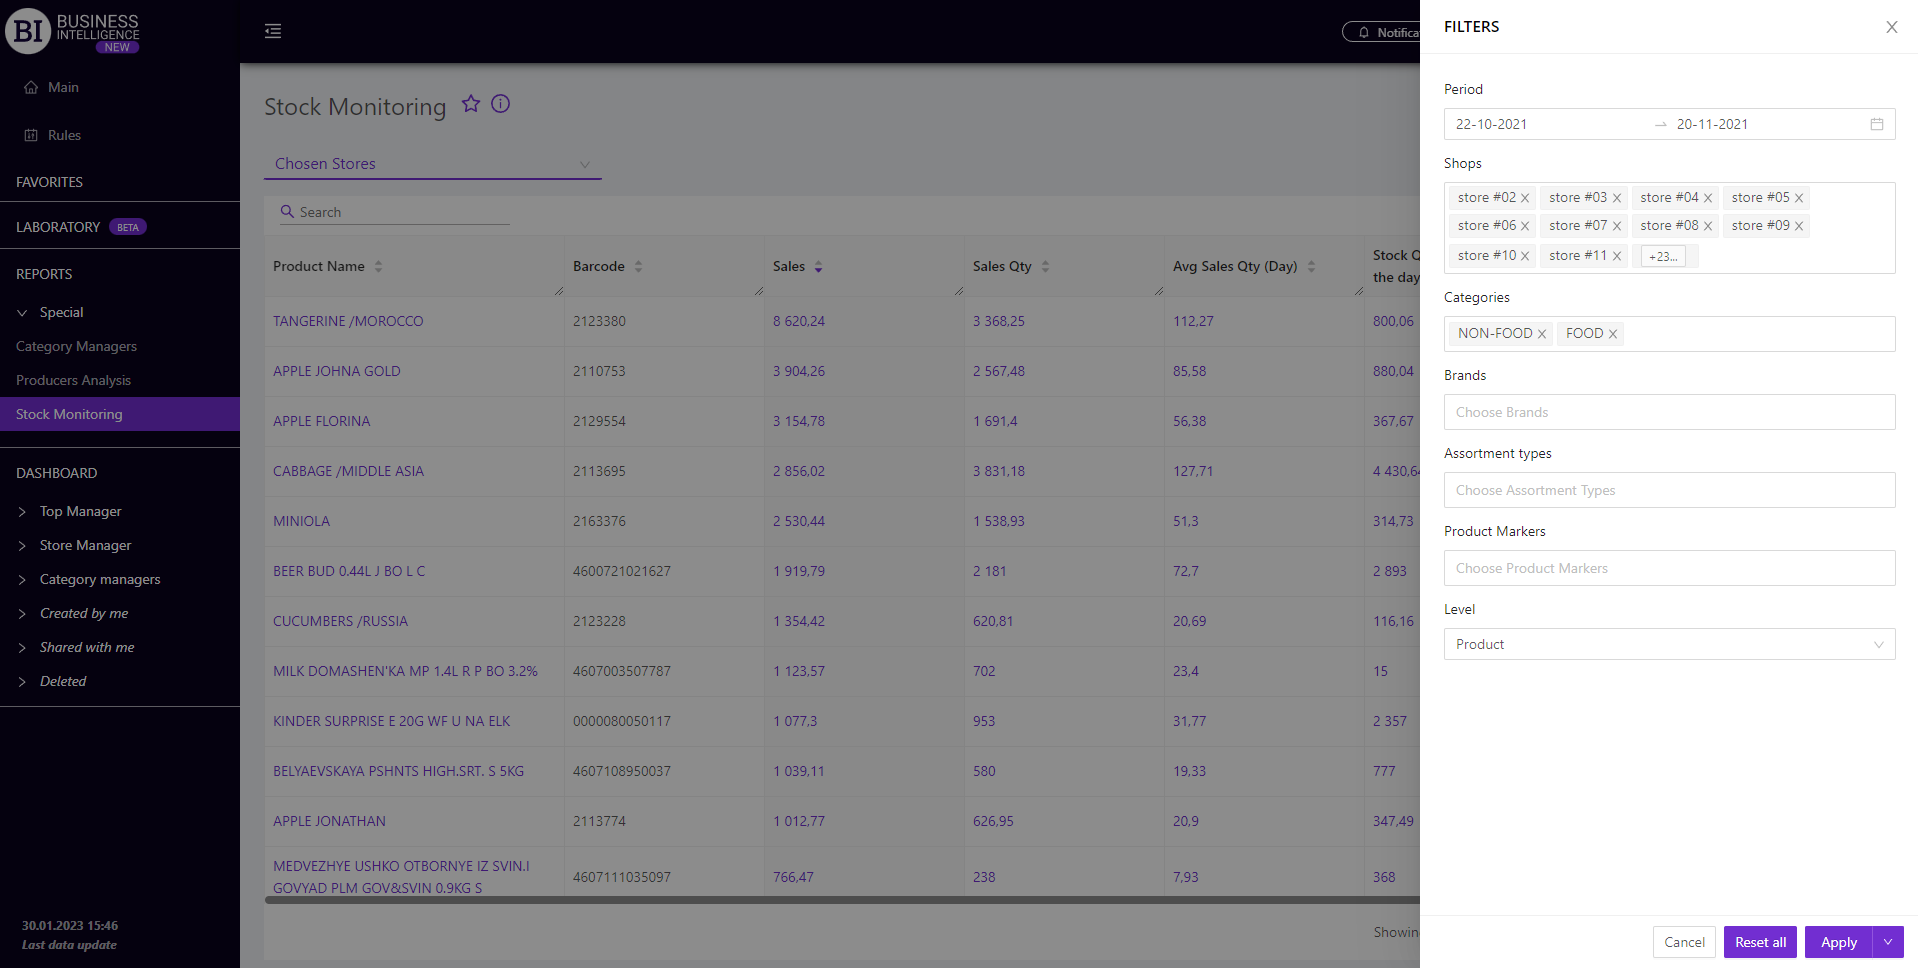
Filters
The selection of filters makes it possible to carry out the analysis within the specified conditions.
Filters button is placed on the right side above the report. Clicking on it opens a modal window with the following filters:
- Period
- Stores
- Categories
- Brands
- Assortment Types
- Product Markers
- Level