Sections
Basket AnalysisQuadrant analysisProducers analysisStore cardProduct CardBrand salesPlanogram EfficiencyLost SalesSuppliers salesCategories salesCategory managersStores salesSales ChangeCategory CardMarkers comparisonProducts salesUnsaleable productsPrediction of OoS24-Hour AnalysisProducts movementEffectiveness of сashiersProducts for adjustmentPOS-terminal TrafficSales PlansNew SKUEffectiveness of Loyalty ProgramPromo CardStatistic of Loyalty ProgramCustomer Loyalty SegmentationLoyalty CardComparative DynamicsReceiptsStock MonitoringMainPromotion AnalysisRFM - analysis24-HOUR ANALYSIS
Reports on Datawiz BI service
The "24-Hour Analysis" report analyses chain sales metrics in terms of a day, week, and hour.
It contains the following tabs: Hour Trend, 24-Hour Analysis.
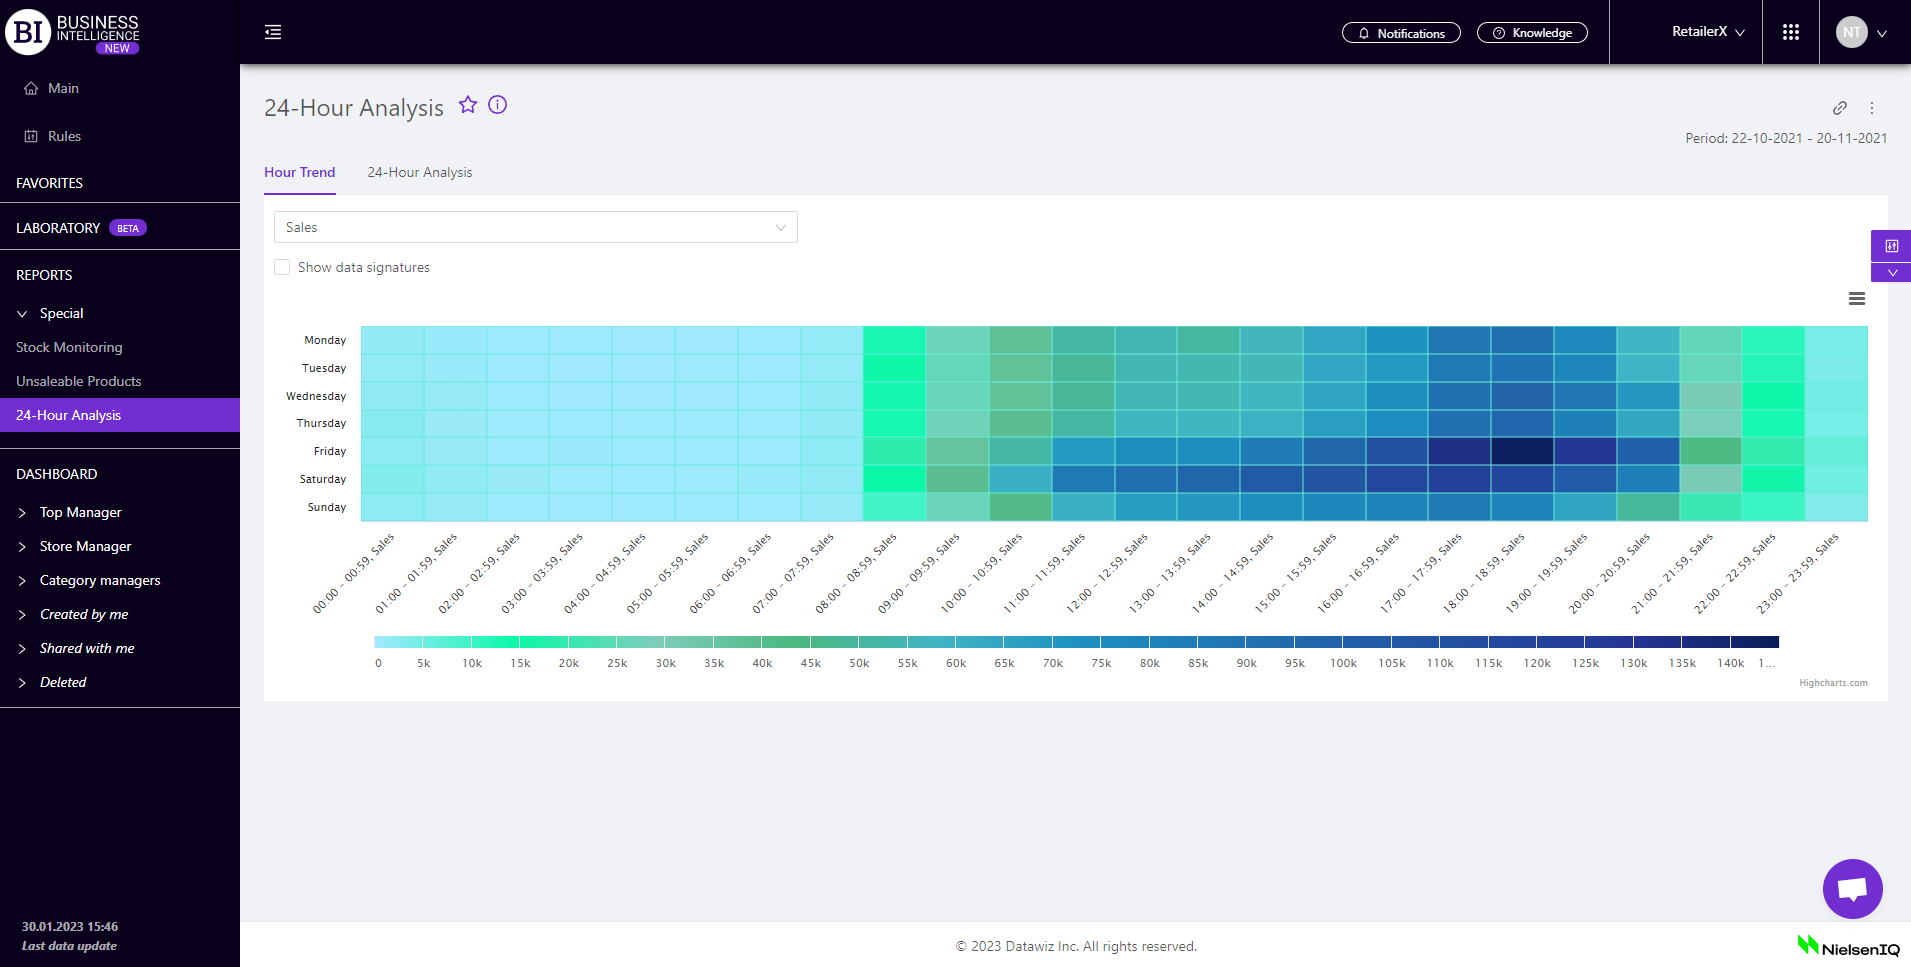
Hour Trend
The "Hour Trend" tab contains a visual breakdown of key sales metrics. The days of the week are indicated vertically, and the hours of the day are indicated horizontally.
Cells of time intervals are painted in different shades: from light to dark. The biggest metric’s value, the darker cell color respectively.
The functionality of the tab allows to:
- visually track the period of time with the greatest load for the sales staff;
- determine when it is necessary to open the maximum number of terminals, cashiers’ availability at their workplaces;
- set up the categories and products that are best sold at the chosen time to ensure a sufficient quantity available on the shelves.
Mark the cell with the flag - Show Data Signatures (on the left above the visualization) to display the metrics’ values.
The image can be saved to a PNG file.
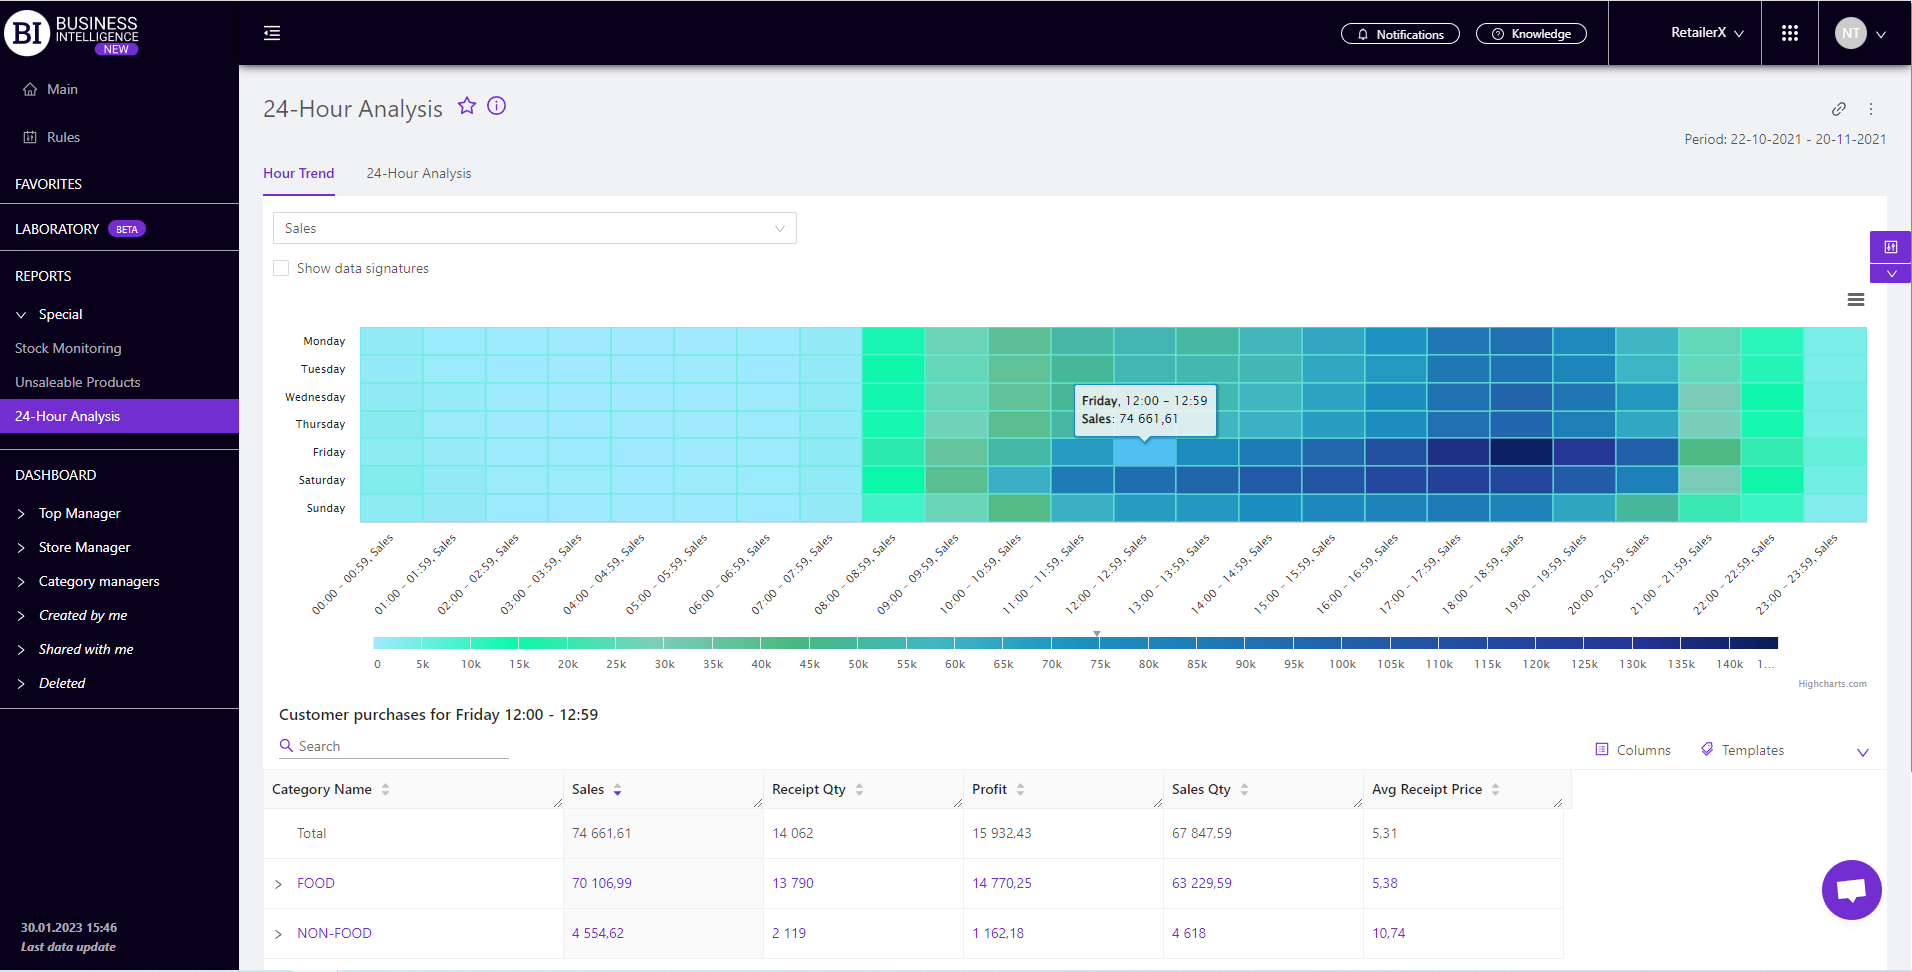
Cells of time intervals are interactive. Clicking on them displays the "Client Purchases" table for the chosen day of the week and time interval. It contains data on categories (products) that were purchased by clients during this period.
"Columns" button allows to choose the necessary metrics for generating a report on:
"Templates" button - saves the configured report columns as a template.
On the right above the table a context menu is opened where the user can select the following actions:
- "Lock the total row" - fixes the "Total" row in the top row of the table.
- "Save XLS" - saves table data to an xls-file.
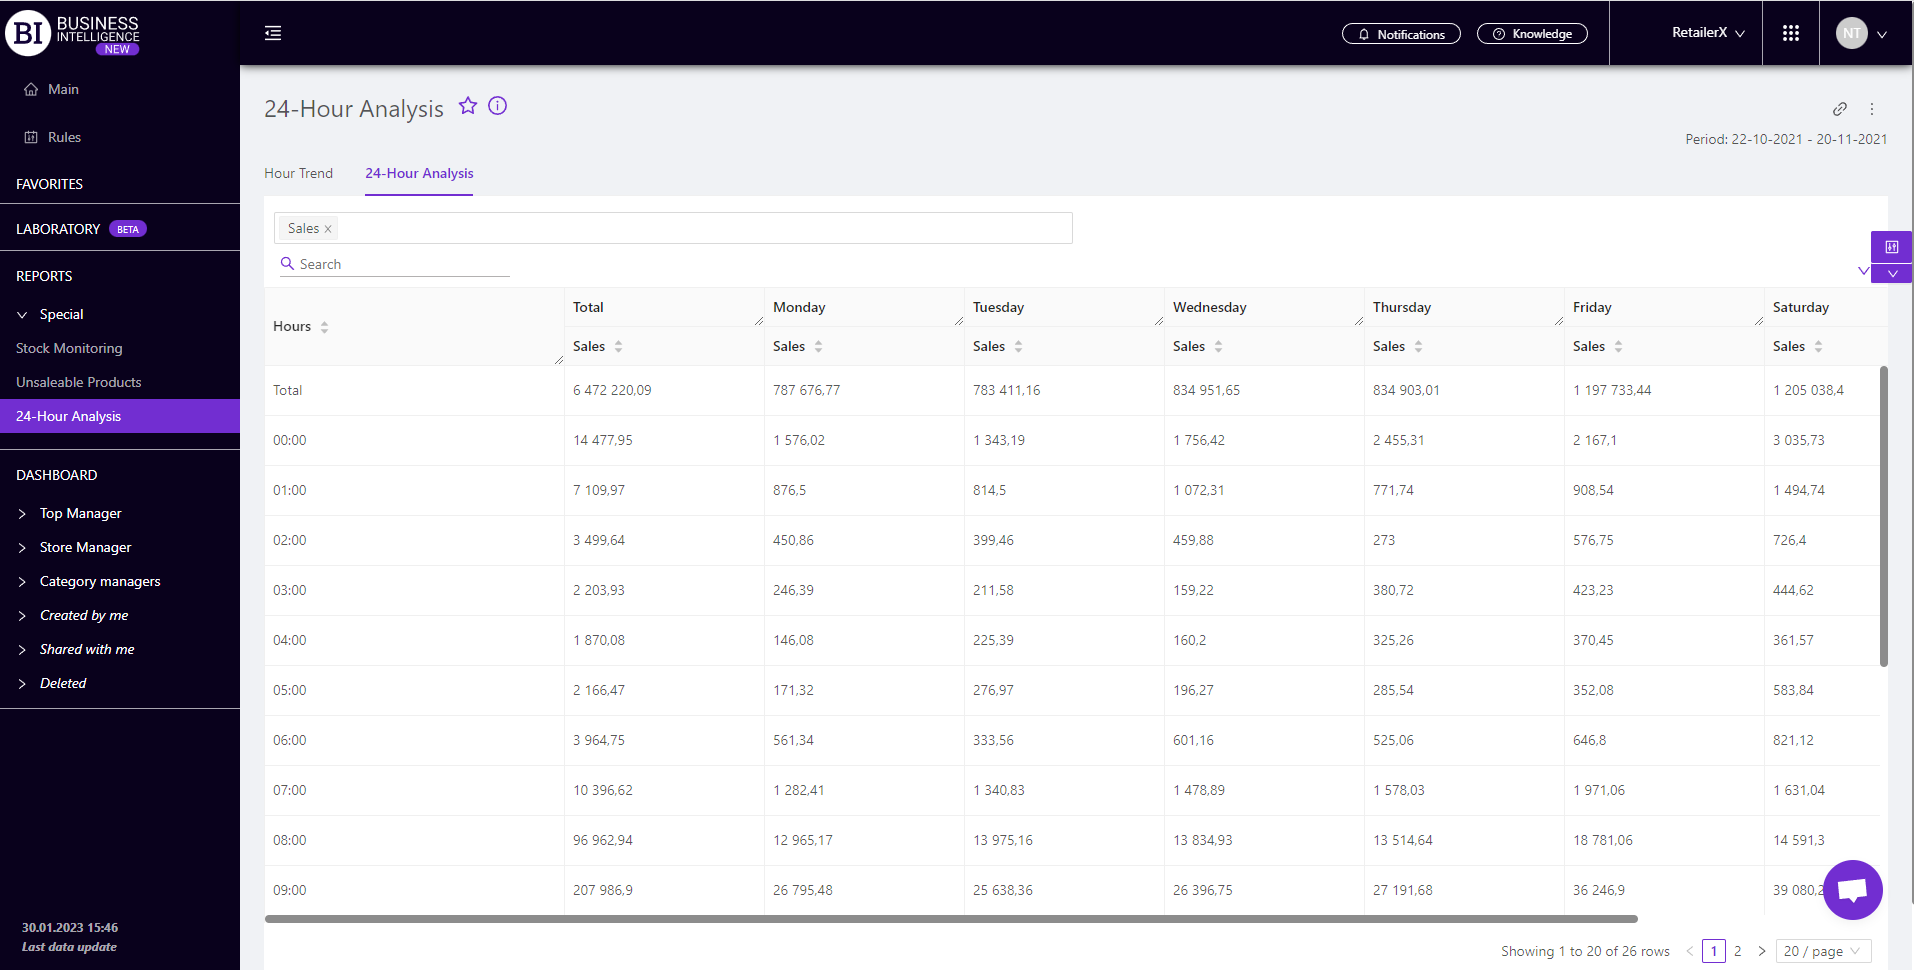
24-Hour Analysis
The "24-Hour Analysis" tab contains a table with the main metrics of sales, which allow you to:
- choose the right sales metric for a detailed time analysis;
- view the required data in terms of days, weeks, and hours;
- determine when SKUs, or product categories are most intensively sold;
- analyze the time when the terminals and staff are the most loaded.
Metrics
The following metrics are available for analysis on the report tabs:
- Sales
- Avg Sales
- Profit
- Avg Profit
- Receipt Qty
- Avg Receipt Qty
- Sales Qty
- Avg Sales Qty
- Avg Receipt Price
- Margin, %
- Qty of active SKU
To choose a metric click on the field on the left above the visualization/table and choose the necessary metric from the pop-up list.
You can choose one metric to build the visualization and the table allows multi-selection of metrics, as well as to analyze up to six metrics simultaneously.
Note! Access to viewing metrics according to the user's role is determined by the administrator. Contact your administrator to expand the access.
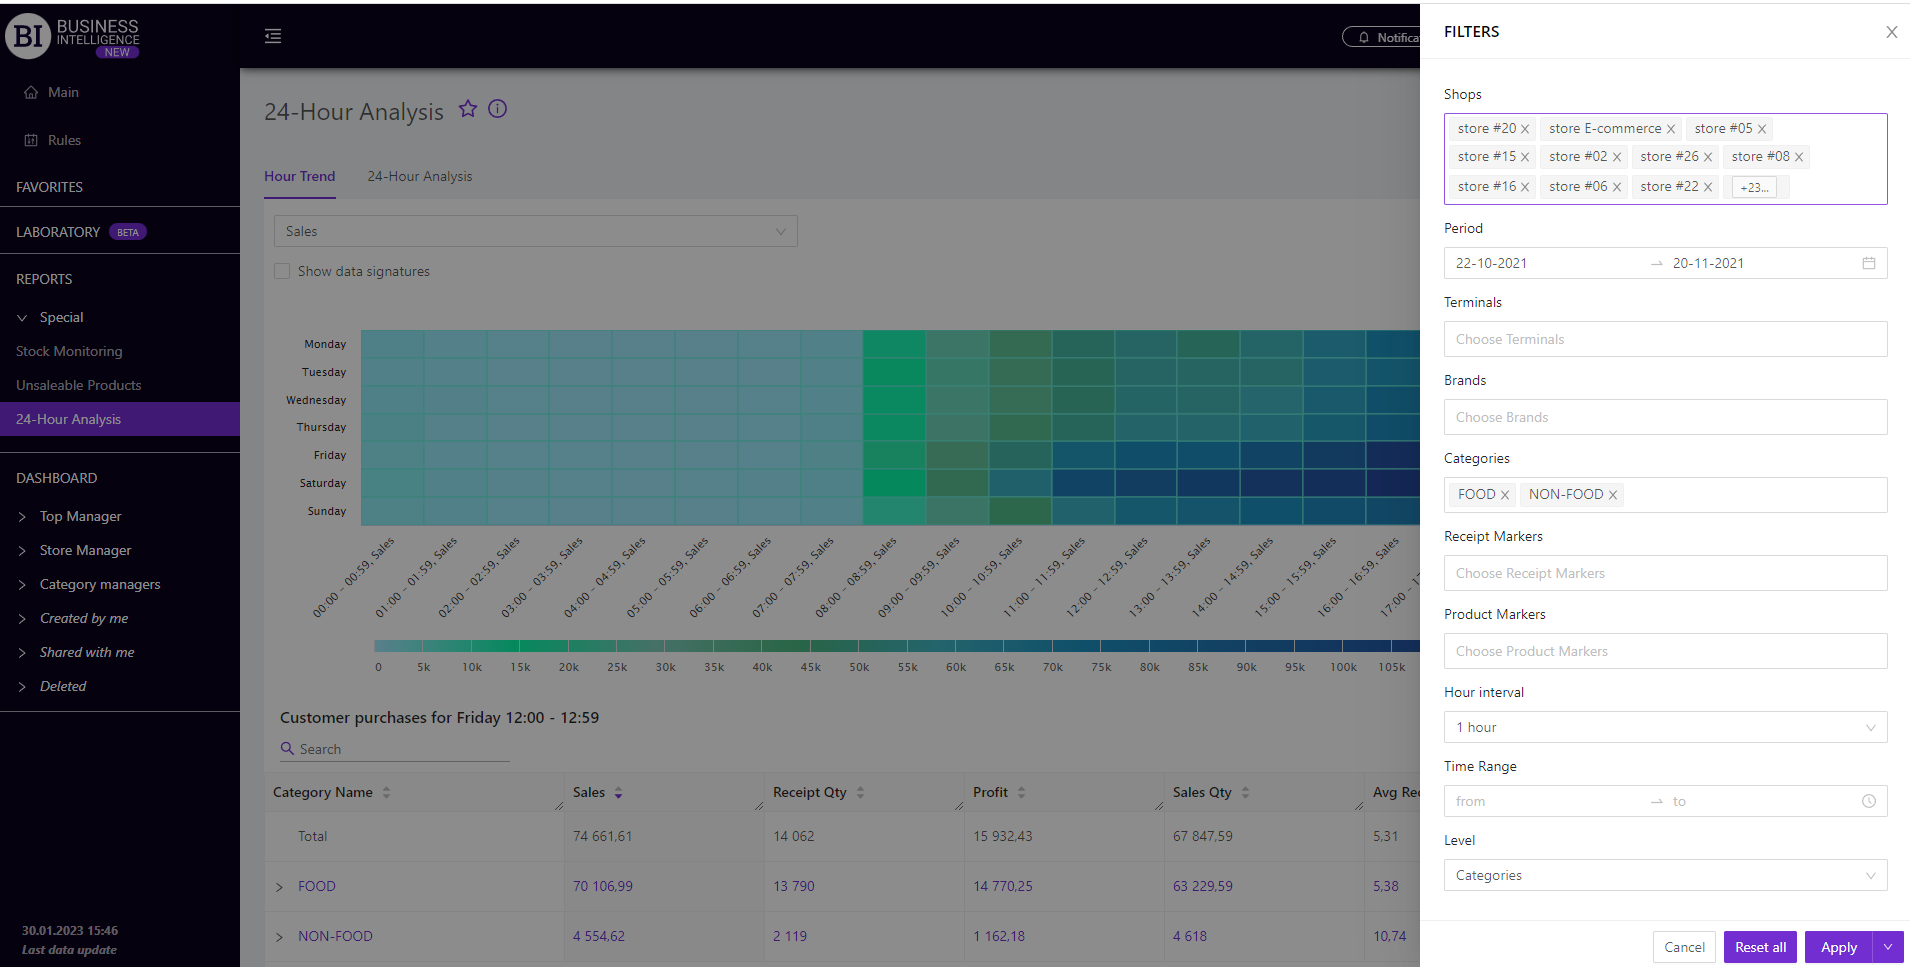
Filters
The selection of filters makes it possible to carry out the analysis within the specified conditions.
Filters button is placed on the right side above the report. Clicking on it opens a modal window with the following filters:
- Stores
- Period
- Terminals
- Brands
- Categories
- Receipt markers
- Product Markers
- Hour Interval
- Time range
- Level