Sections
Basket AnalysisQuadrant analysisProducers analysisStore cardProduct CardBrand salesPlanogram EfficiencyLost SalesSuppliers salesCategories salesCategory managersStores salesSales ChangeCategory CardMarkers comparisonProducts salesUnsaleable productsPrediction of OoS24-Hour AnalysisProducts movementEffectiveness of сashiersProducts for adjustmentPOS-terminal TrafficSales PlansNew SKUEffectiveness of Loyalty ProgramPromo CardStatistic of Loyalty ProgramCustomer Loyalty SegmentationLoyalty CardComparative DynamicsReceiptsStock MonitoringMainPromotion AnalysisRFM - analysisRFM - ANALYSIS
Reports on Datawiz BI service
The "RFM-Analysis" report allows to distribute and analyze all clients by parameters:
- Recency - shows how long ago a client has made a purchase.
- Frequency - shows how often the client visits the store.
- Monetary - shows what is the average amount of money the client spends.
The report helps to know which clients, when, and with what offers it is necessary to address to maintain their interest in further purchases of products and services.
The RFM-Analysis allows to:
- minimize the cost of time and resources to motivate clients;
- increase the main metrics of your store: profit and sale;
- confirm the effectiveness of marketing activities;
- objectively assess the effectiveness of the marketing department.
Client Segmentation in RFM-Analysis
Consider the example of how the division into groups by values (sales) is performed. Let's take the sales data on 5 clients for the chosen period: 120, 250, 300, 140, and 20 UAH. Let’s sort them in ascending order:
Client Sales (UAH)
1 20
2 120
3 140
4 250
5 300
To divide the group into three levels, it is necessary to determine what numerical value of 33% and 66% (thirds parts of the sample) will be equal to the clients’ sales. In the future these values will be the grouping limits for three groups (calculated on the basis of quantiles):
[0 - 33%] - Group 3 - the cost of purchases is low;
[33.1 - 66%] - Group 2 - the cost of purchases is medium;
[66.1 -100%] - Group1 - the cost of purchases is high.
According to the example, 33% will be 126.4 UAH, and 66% - 210.4 UAH. Then the criteria for the division of clients by sales will be as follows:
20.0 - 126.4 UAH - 3rd group;
126.5 - 210.4 UAH - 2nd group;
210.5 UAH and more - 1-st group.
Client Sales (UAH) Groups (М)
1 20 3
2 120 3
3 140 2
4 250 1
5 300 1
Similarly, grouping is performed by frequency of purchases (F). All clients are divided into three groups:
- [0 - 33%] - group 3 - make the purchases rarely;
- [33.1 - 66%] - group 2 - make the purchases not often;
- [66.1 -100%] - group 1 - make the purchases often.
Dividing clients by recency of purchases (R), the reverse principle of groups allocating should be applied:
- [0 - 33%] - group 1 - visited the store recently ;
- [33.1 - 66%] - group 2 - visited the store not too long ago;
- [66.1 -100%] - group 3 - visited the store too long ago.
So, knowing that the client is in group 211 (visited the store not too long ago; makes the purchases often; the cost of purchases is high), he/she should be reminded of the store benefits, and encouraged visiting the store. And 333 clients are the least valuable and you should not spend time and make an effort on this segment.
The report contains two tabs: Client Groups and Anomaly Clients.
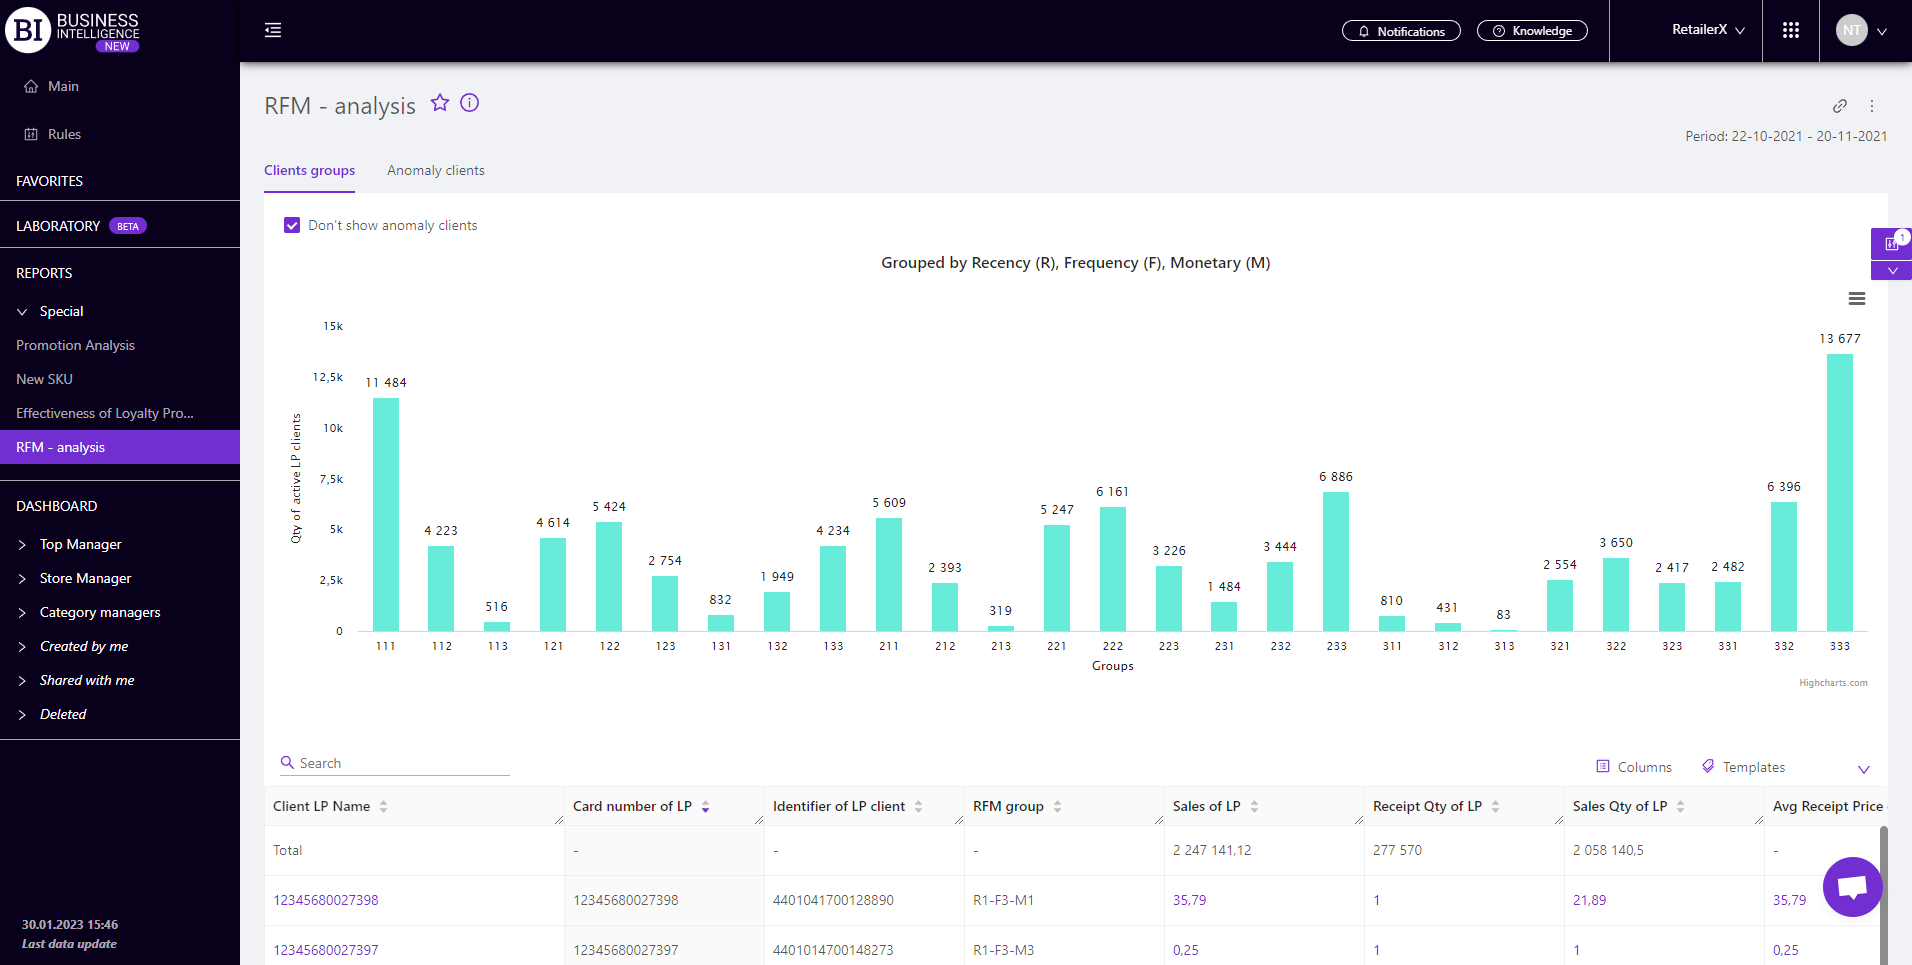
Client groups
The "Clients groups" tab displays basic sales information by LP clients groups. Its functionality allows to:
-
review the qty of LP clients included in each group in terms of Recency, Frequency, Monetary;
-
analyze the purchases of individual clients’ groups;
-
visually track key sales metrics for each client in the group.
There is "Grouped by Recency (R), Frequency (F), Monetary (M)" visualization at the top. It shows the division of LP clients into RFM-Analysis Groups.
Mark the cell with the flag - Don't Show Anomaly Clients (on the left above the visualization) to hide the data on anomaly clients.
There is a table below which shows the sales metrics of all clients of the chain in the chosen period.
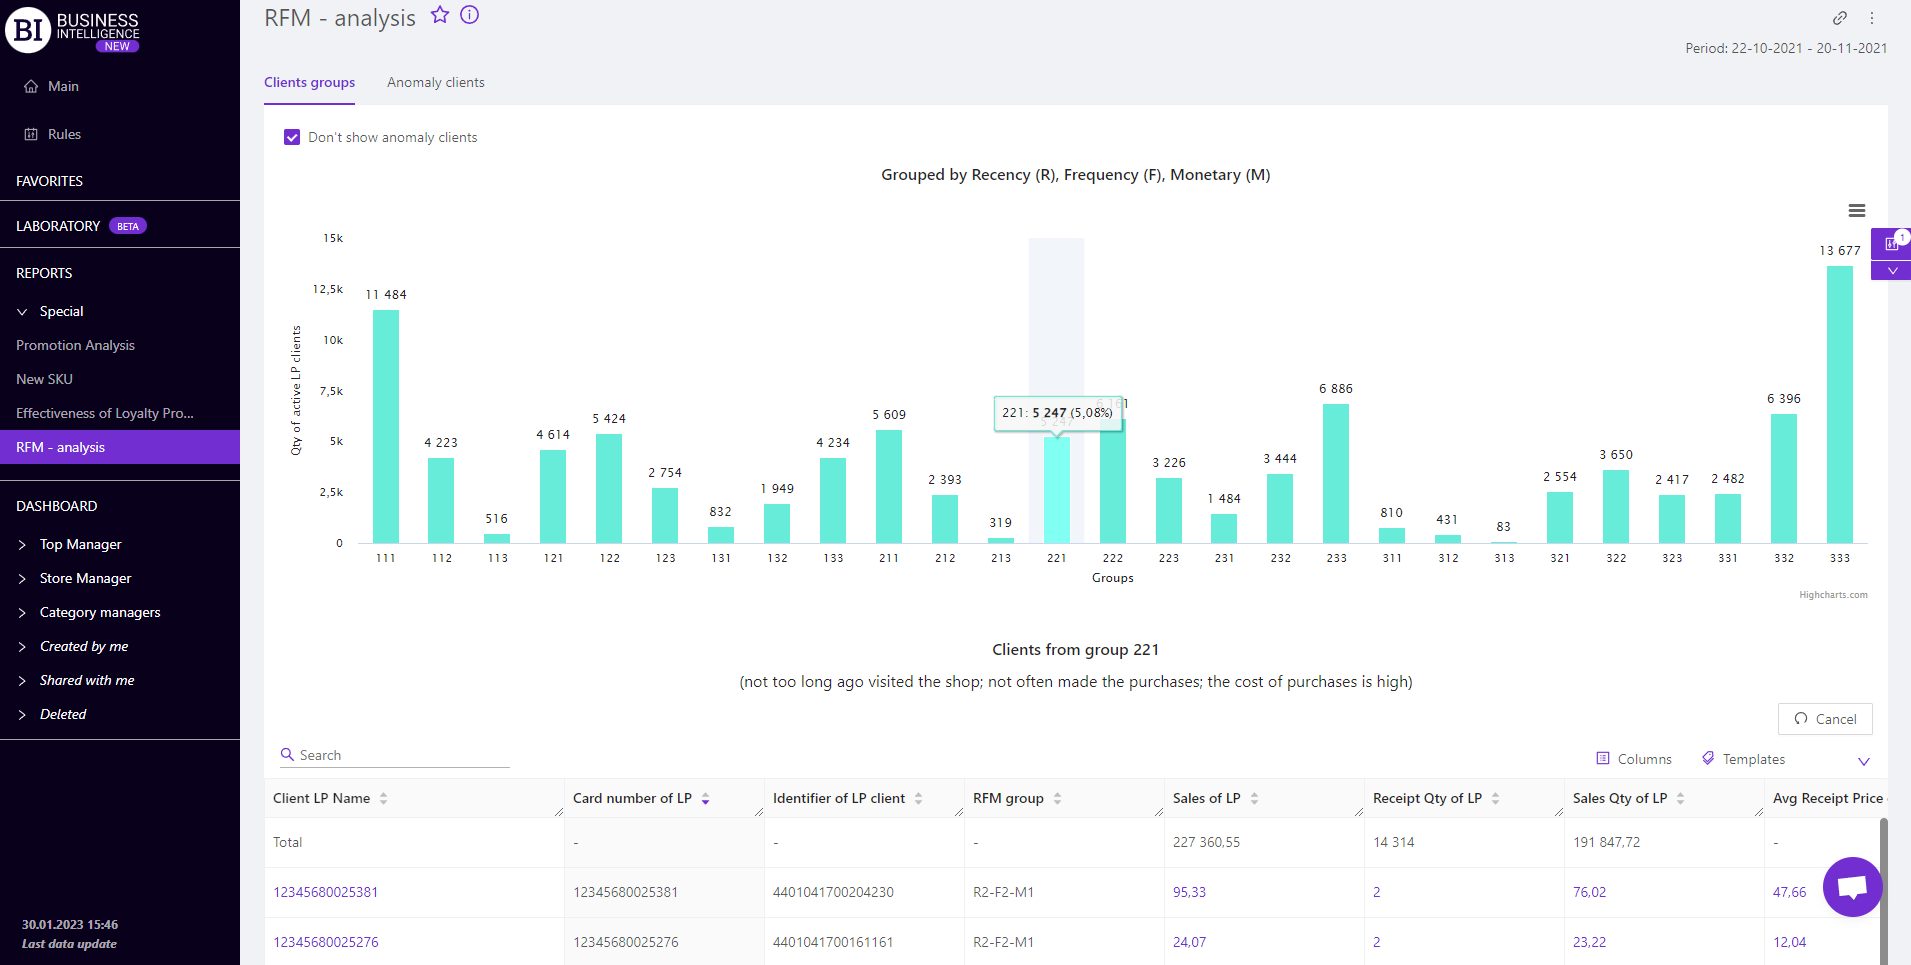
Clicking on the column graph filters the table, and displays the data on the chosen group of LP clients.
Cancel button on the right above the table returns you to the general list of LP clients for the chosen period.
Anomaly Clients
The "Anomaly Clients" tab summarizes the sales metrics of the anomaly clients. Its functionality allows to:
- identify the facts of anomaly behavior out of LP clients;
- evaluate sales performance out of clients with "unusual" behavior;
- visually track sales dynamics for each anomaly client.
Anomaly clients are clients who are radically different from other clients by their behavior. Sometimes such clients include cashiers or other employees who misuse their bonus card.
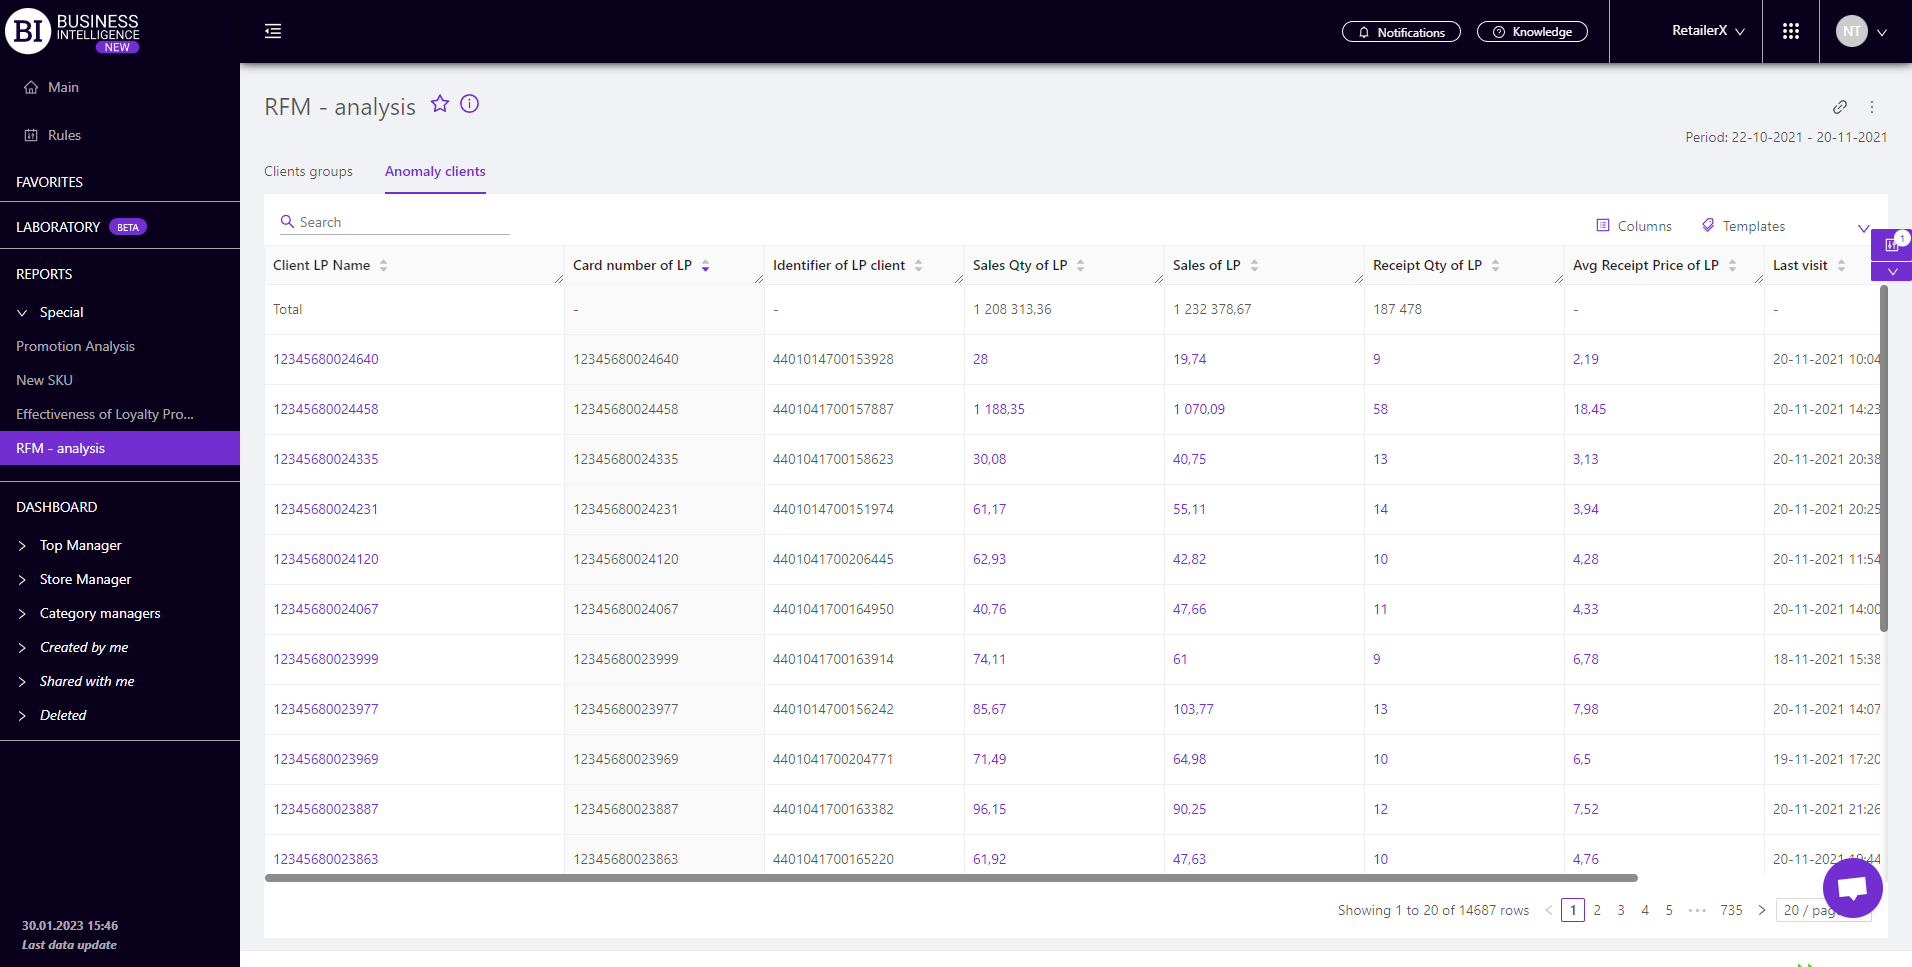
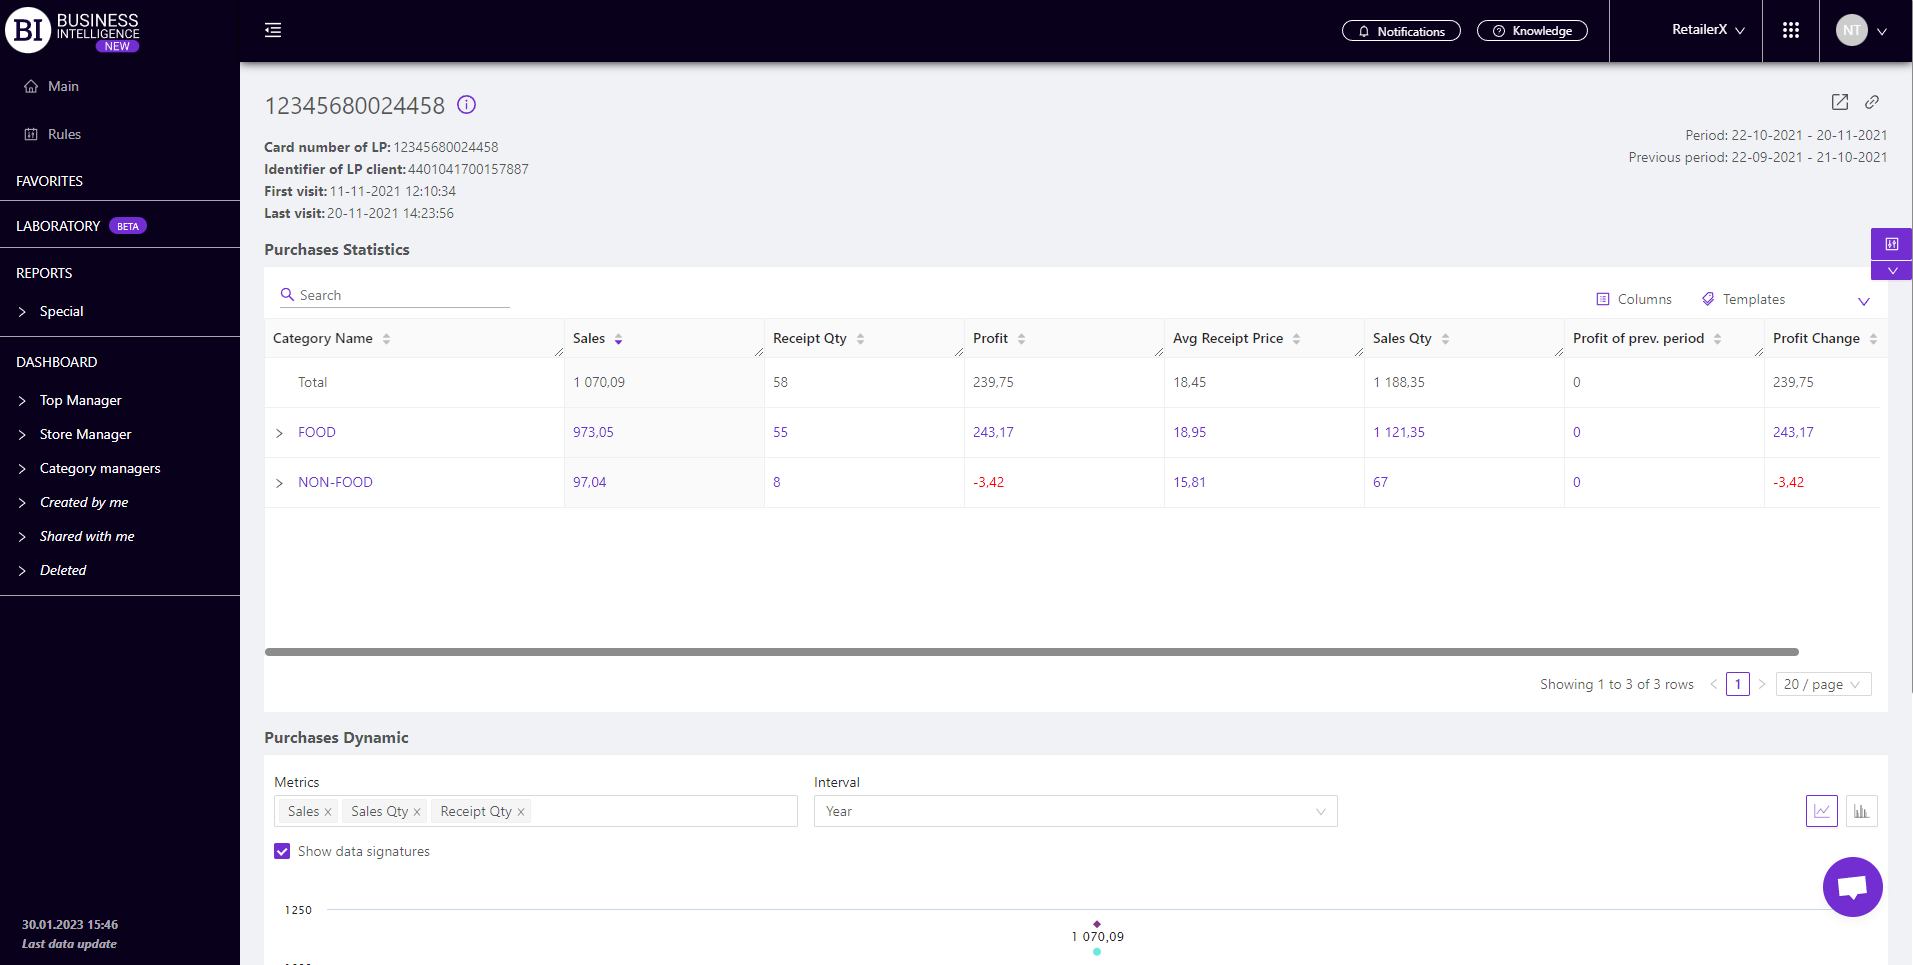
LP Client Card
When you click on the client's name in the report table, the "LP Client Card" report opens. It shows the basic data for the chosen period.
Metrics
"Columns" button allows to choose the necessary metrics for generating a report:
- Card number of LP
- Identifier of LP client
- RFM group
- Sales of LP
- Sales Qty of LP
- Receipt Qty of LP
- Avg Receipt Price of LP
- Last visit
- Age of LP client
Note! Access to viewing metrics according to the user's role is determined by the administrator. Contact your administrator to expand the access.
Metrics highlighted in purple or red are clickable. Clicking on them opens a window with a flow chart of the chosen metric.

"Templates" button - saves the configured report columns as a template.
On the right above the table a context menu is opened where the user can select the following actions:
- "Lock the total row" - fixes the "Total" row in the top row of the table.
- "Save XLS" - saves table data to an xls-file.
To quickly find the LP client enter the first letters of the client’s name/surname in the search field. The search works automatically, leaving all found matches in the table.
Click on the cross in the search field to reset the search results.

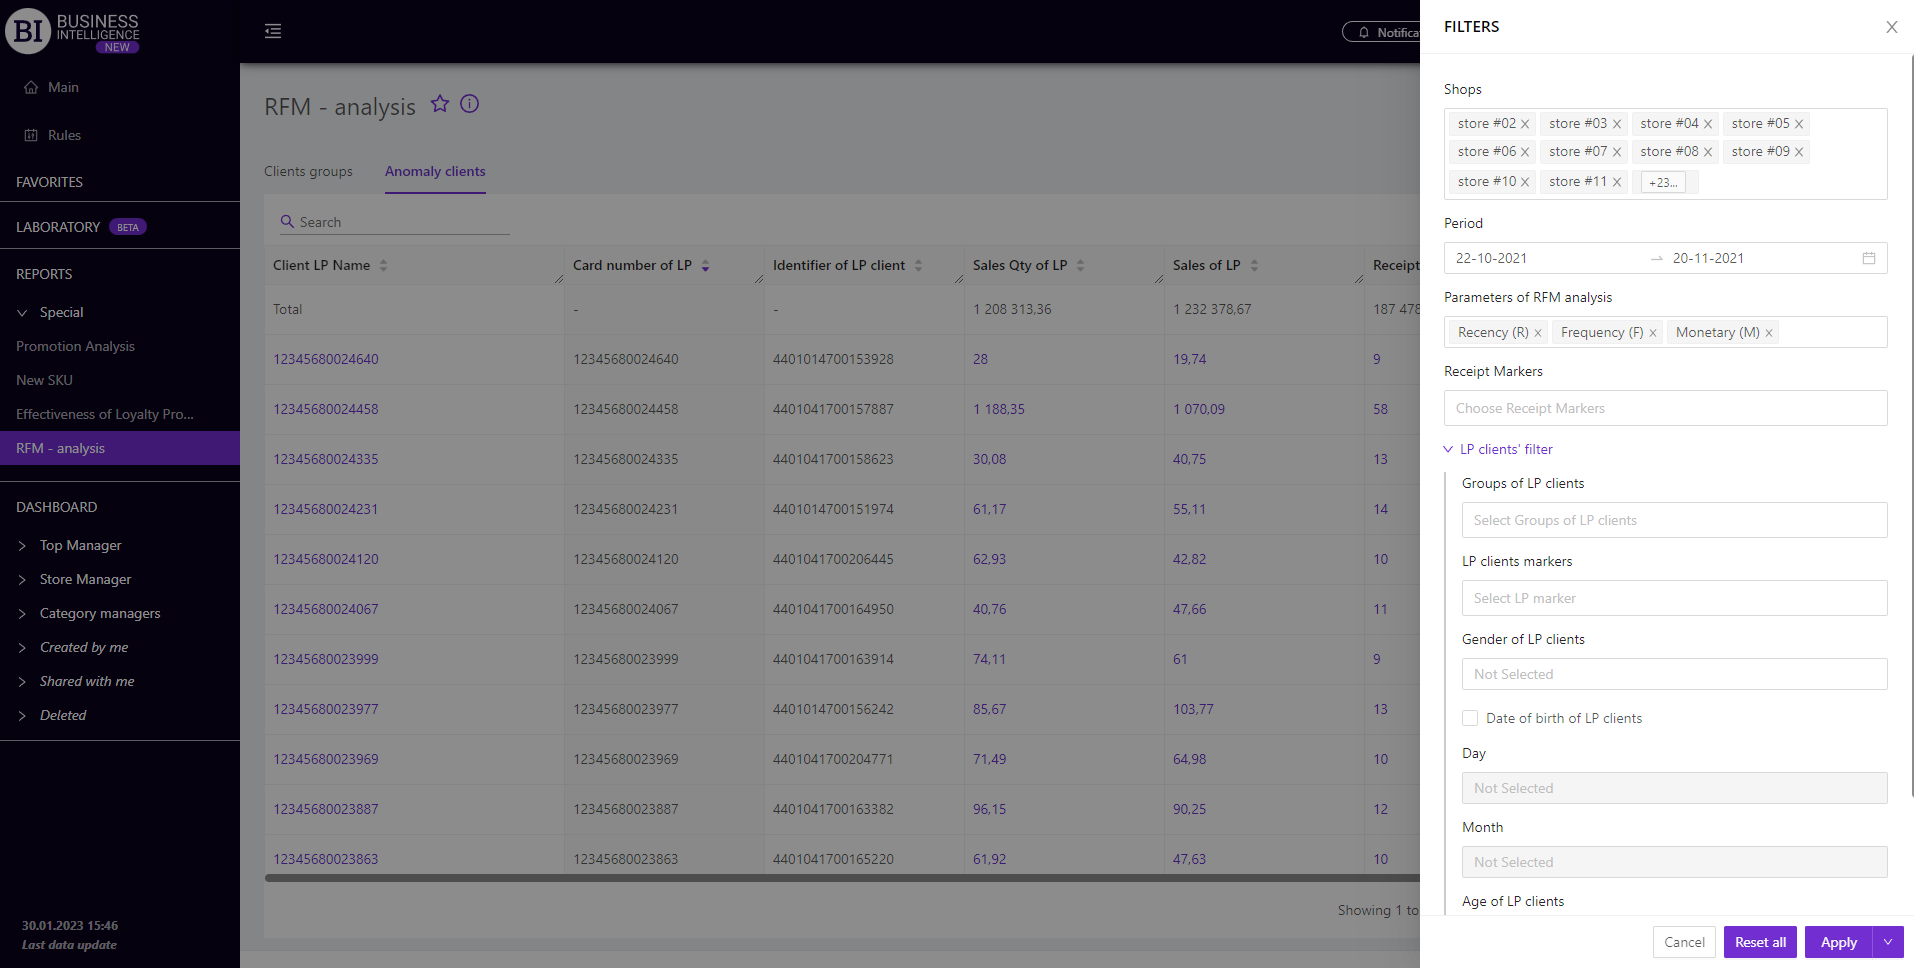
Filters
The selection of filters makes it possible to carry out the analysis within the specified conditions.
Filters button is placed on the right side above the report. Clicking on it opens a modal window with the following filters:
- Stores
- Period
- Parameters of RFM-analysis
- Receipt markers
- LP Clients’ Filter