Sections
Basket AnalysisQuadrant analysisProducers analysisStore cardProduct CardBrand salesPlanogram EfficiencyLost SalesSuppliers salesCategories salesCategory managersStores salesSales ChangeCategory CardMarkers comparisonProducts salesUnsaleable productsPrediction of OoS24-Hour AnalysisProducts movementEffectiveness of сashiersProducts for adjustmentPOS-terminal TrafficSales PlansNew SKUEffectiveness of Loyalty ProgramPromo CardStatistic of Loyalty ProgramCustomer Loyalty SegmentationLoyalty CardComparative DynamicsReceiptsStock MonitoringMainPromotion AnalysisRFM - analysisNEW SKU
Reports on Datawiz BI service
The "New SKU" report summarizes the main sales metrics for new products in the chain to determine the feasibility of their introduction into the assortment.
The functionality of the report allows to:
- review the sales quantity of new SKUs at different levels (regions, areas and certain stores);
- quickly know the total quantity of new products in the chain and the sales generated by them;
- visually track the main sales metrics for the entered product items.
There are information cards with metrics on the right which display basic information on the new SKUs, namely:
The cards indicate the actual value of the metrics and the chosen period.
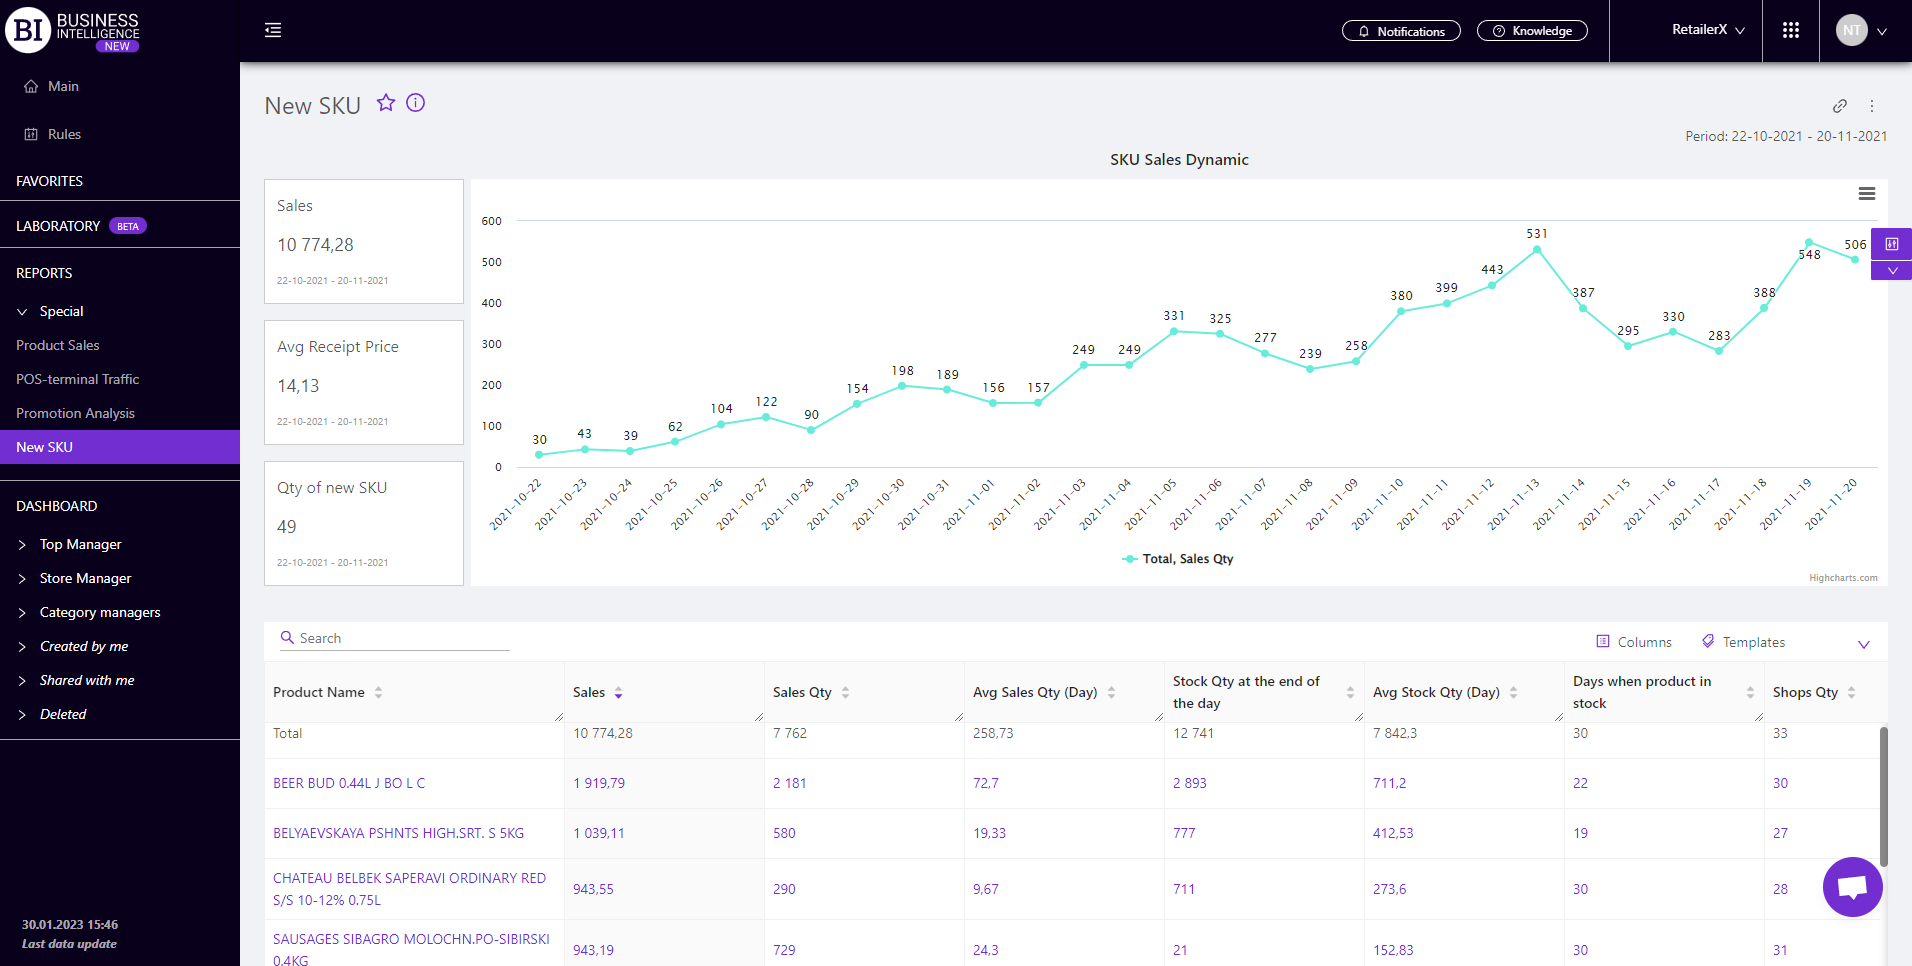
On the left is a visualization of the "SKU Sales Dynamic" which shows the sales qty of new products for the chosen period in stores (regions, areas).
In the filters you can set the necessary level of data display on the graph: regions, areas, stores.
To hide the sales qty of certain stores on the visualization it is enough to use the navigation under it.
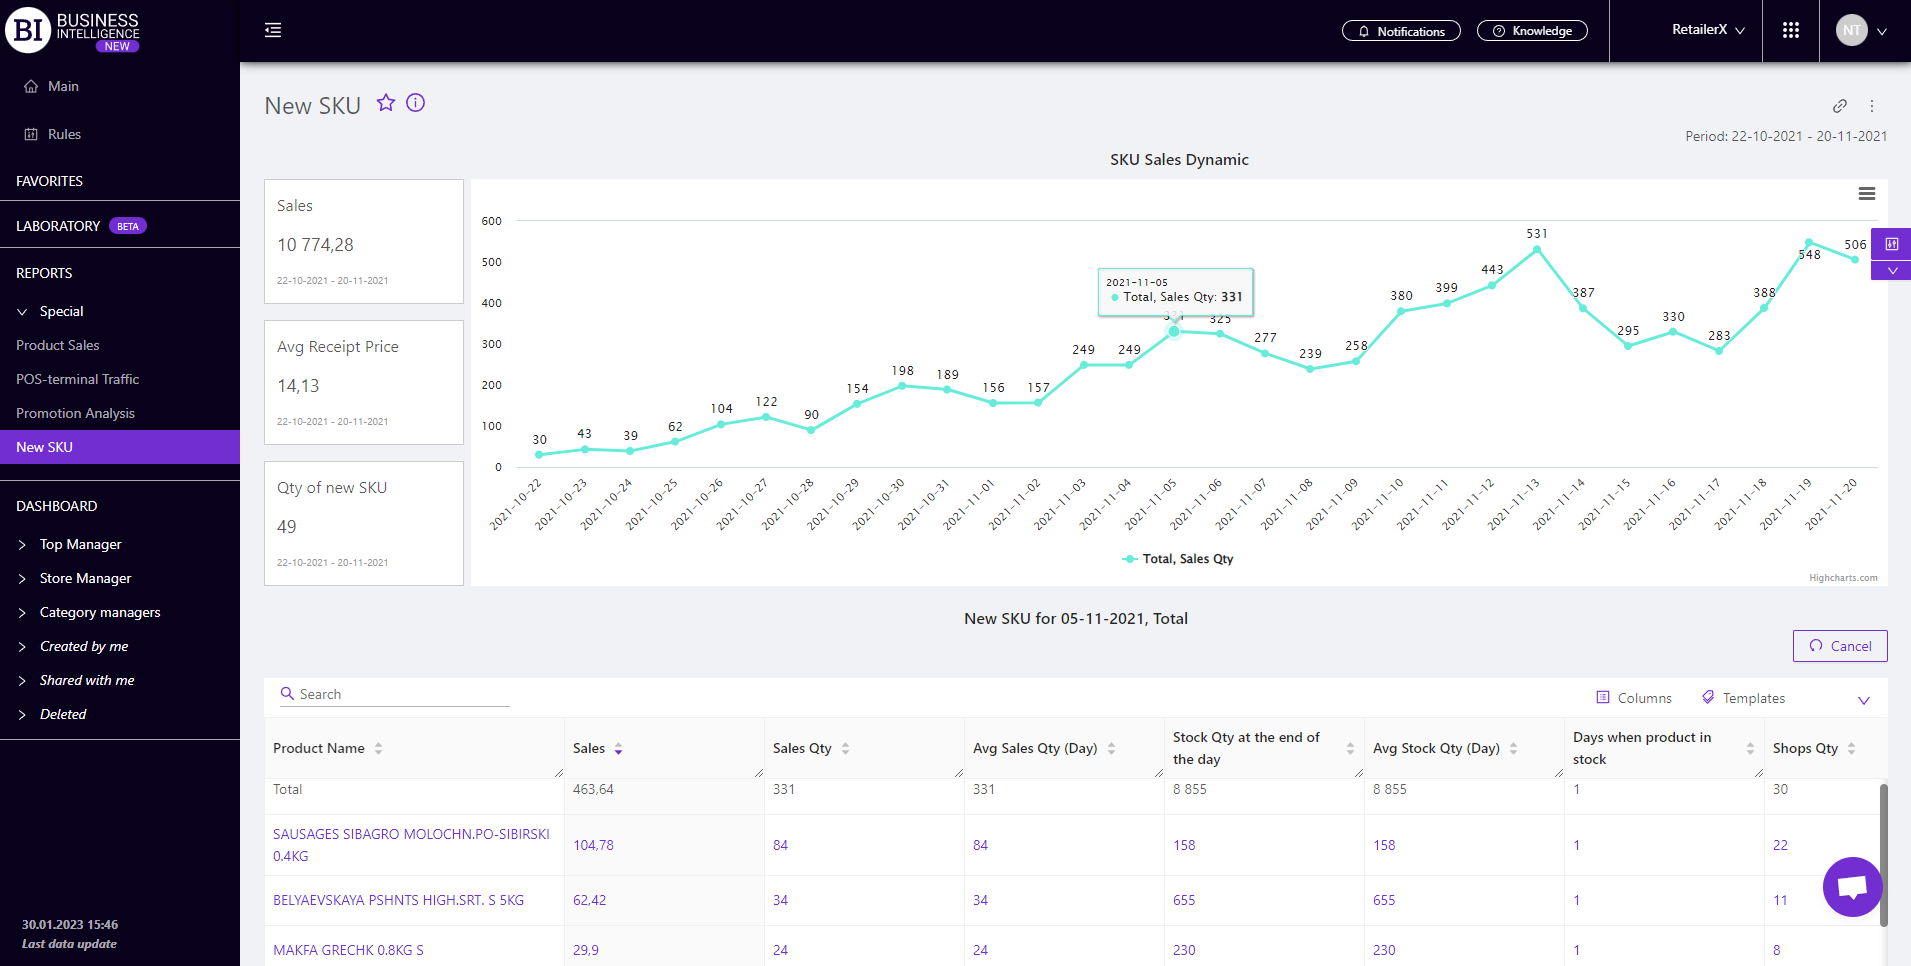
There is a table below that shows all new SKU with sales during the chosen period and the main metrics for them.
Clicking on the value of the graph metric filters the table "New SKU" for the corresponding date.
Cancel button right above the table returns you to the general list of the products entered into the assortment of a chain for all periods adjusted in filters.
Metrics
"Columns" button allows to choose the necessary metrics for generating a report:
- Sales
- Sales Qty
- Receipt Qty
- Avg Receipt
- Stock Qty at the end of the day
- Stock primecost at the end of the day
- Stock Qty at the beginning of the day
- Stock Primecost at the beginning of the day
- Profit
- Price
- Primecost
- Margin %
- Days, that product not sold
- Identifier
- Barcode
Note! Access to viewing metrics according to the user's role is determined by the administrator. Contact your administrator to expand the access.
Metrics highlighted in purple or red are clickable. Clicking on them opens a window with a flow chart of the chosen metric.
"Templates" button - saves the configured report columns as a template.
On the right above the table a context menu is opened where the user can select the following actions:
- "Lock the total row" - fixes the "Total" row in the top row of the table.
- "Save XLS" - saves table data to an xls-file.
To quickly find the products you need, enter the first letters/symbols of the product name in the search field. The search works automatically, leaving all found matches in the table.
To reset the search results you must click on the cross in the search field.
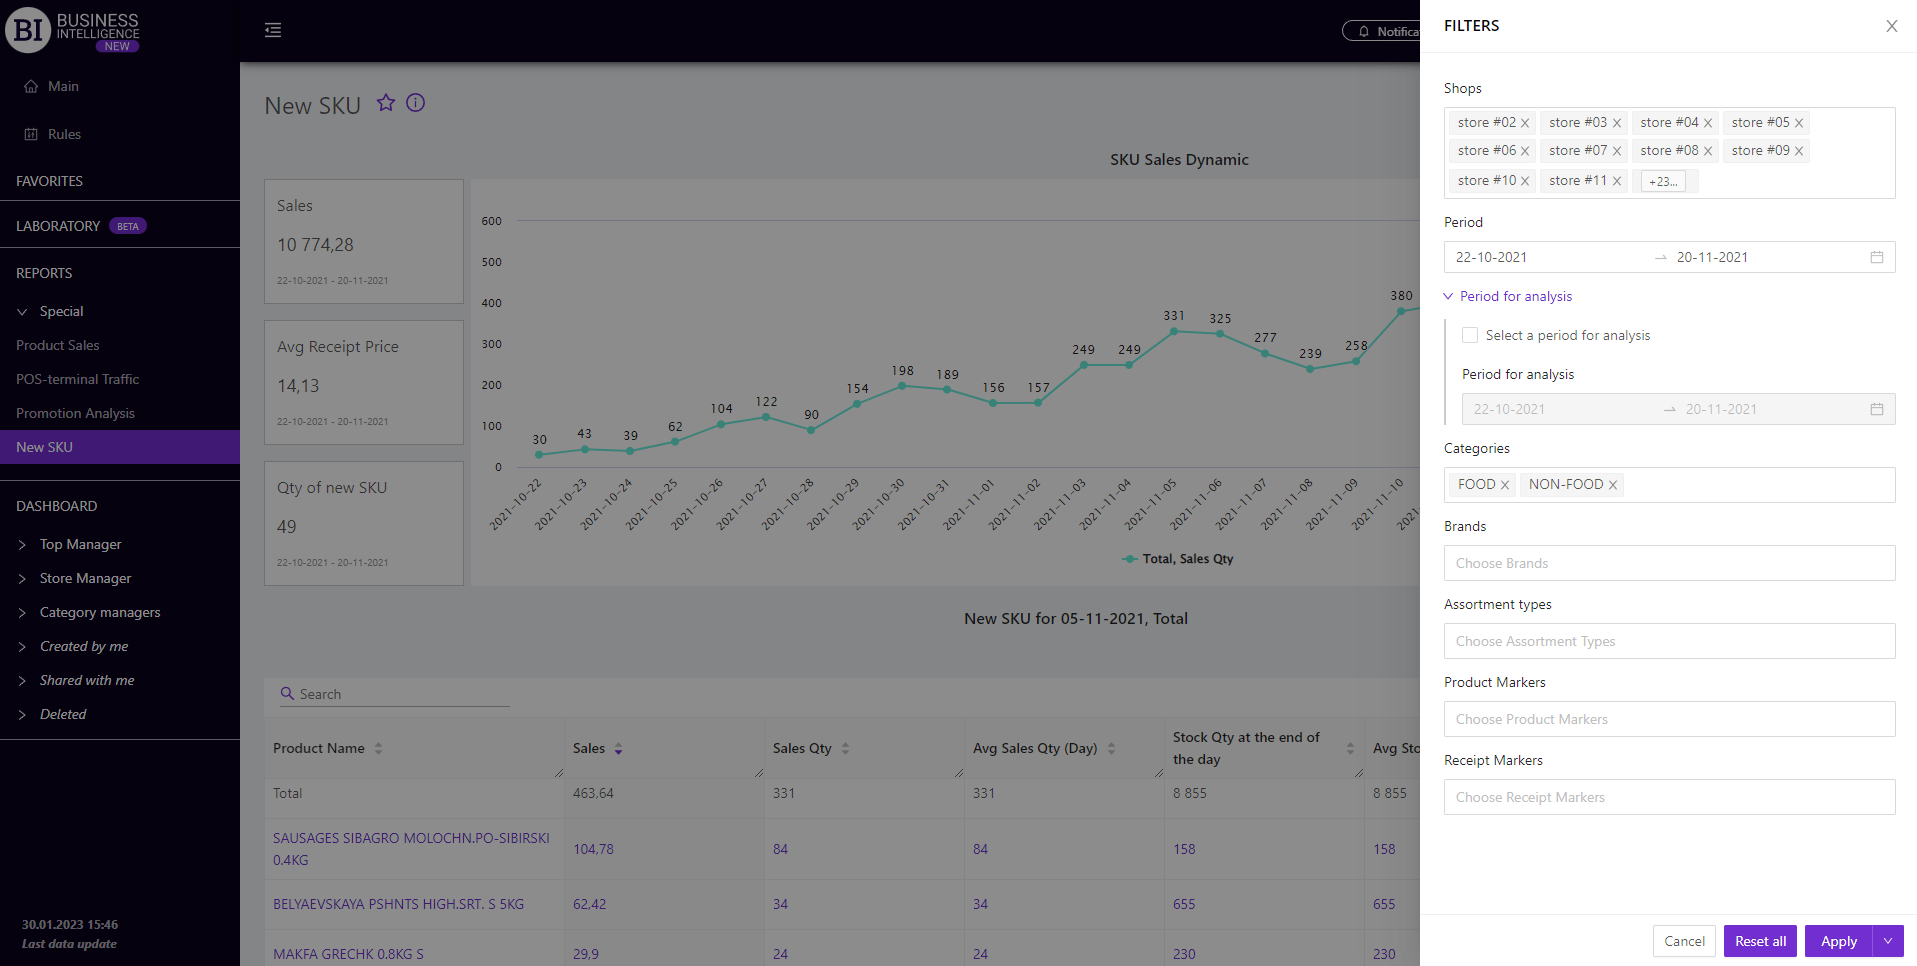
Filters
The selection of filters makes it possible to carry out the analysis within the specified conditions.
Filters button is placed on the right above the report. Clicking on it opens a modal window with the following filters:
- Stores
- Period
- Period for analysis
- Categories
- Brands
- Assortment types
- Product markers
- Receipt markers