Sections
Store cardBasket AnalysisQuadrant analysisProducers analysisProduct CardBrand salesPlanogram EfficiencyLost SalesCategory managersSuppliers salesMarkers comparisonProducts salesCategories salesCategory CardStores salesSales ChangeUnsaleable productsPrediction of OoS24-Hour AnalysisProducts movementEffectiveness of сashiersProducts for adjustmentPOS-terminal TrafficSales PlansPromotion AnalysisNew SKUEffectiveness of Loyalty ProgramPromo CardRFM - analysisStatistic of Loyalty ProgramCustomer Loyalty SegmentationLoyalty CardComparative DynamicsReceiptsStock MonitoringMainPLANOGRAM EFFICIENCY
Reports on Datawiz BI service
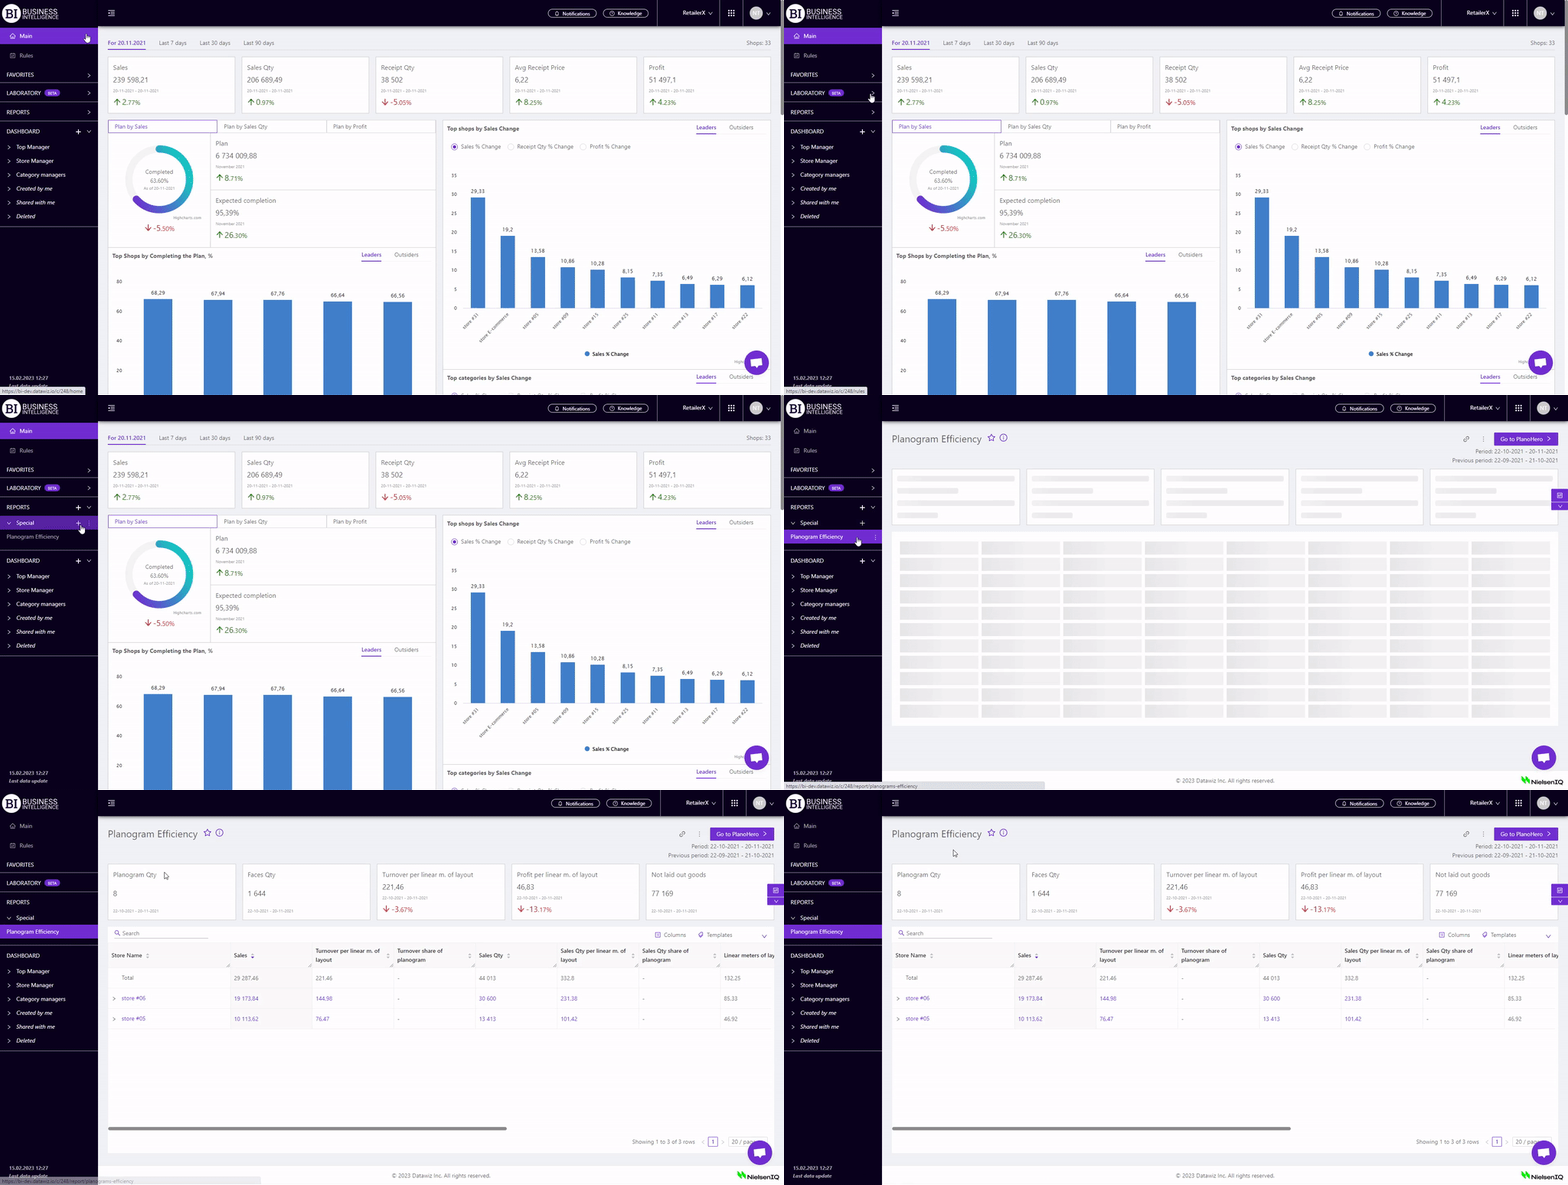
The Planogram Efficiency report summarizes product sales data across store planograms, helping you flexibly analyze and compare product sales.

The report functionality allows to:
- compare the sale of products displayed on the shelves separately for each store and as a whole for the chain;
- view the necessary data on metrics for the selected and previous periods, comparing them with each other;
- visually monitor the dynamics of sales of products according to planograms.
There are information cards with metrics at the top. They display basic information about the planograms for the chosen period, namely:
- Planogram Oty
- Faces quantity
- Turnover per linear m. of layout
- Profit per linear m. of layout
- Not laid out goods

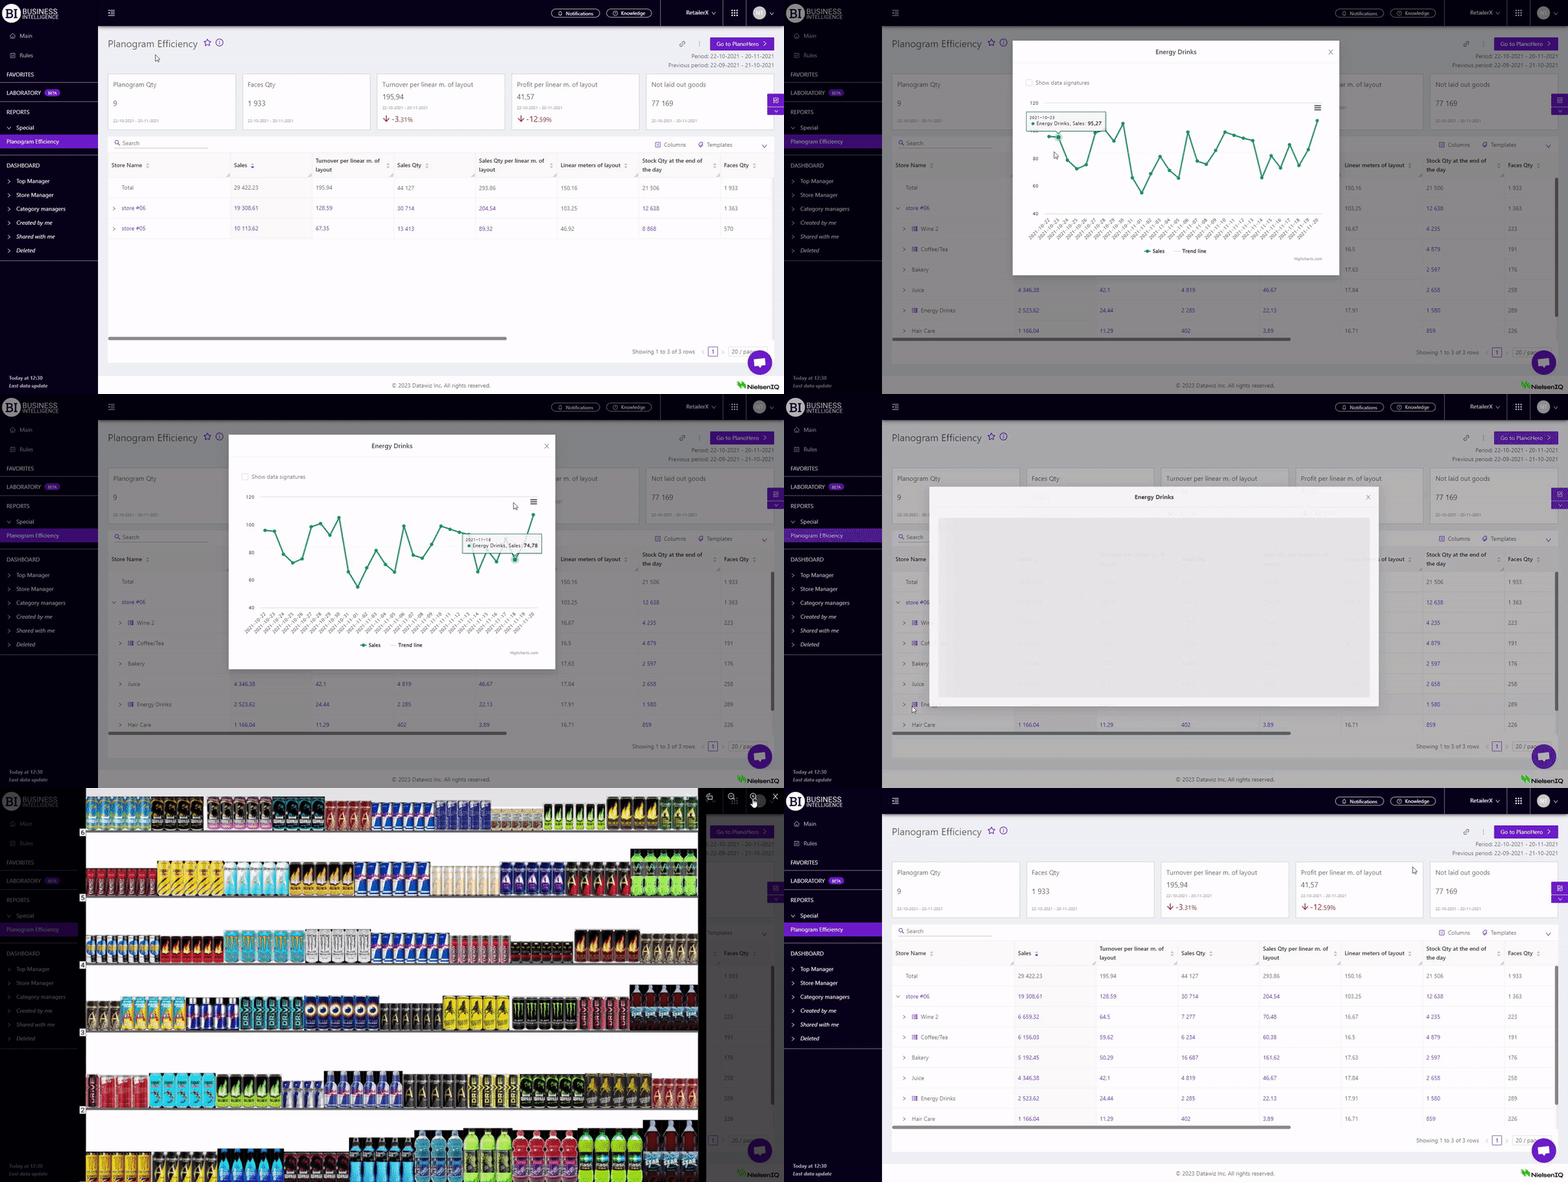
Metrics highlighted in color (purple) are clickable. Clicking on them opens a window with a graph of the dynamics of the selected metric.
Note! The table expands by levels, starting with the level specified in the report filters. Clicking on the name of the planogram opens a modal window with the planogram and attached photo report.
By default, the "Planogram" level is selected in the filters.

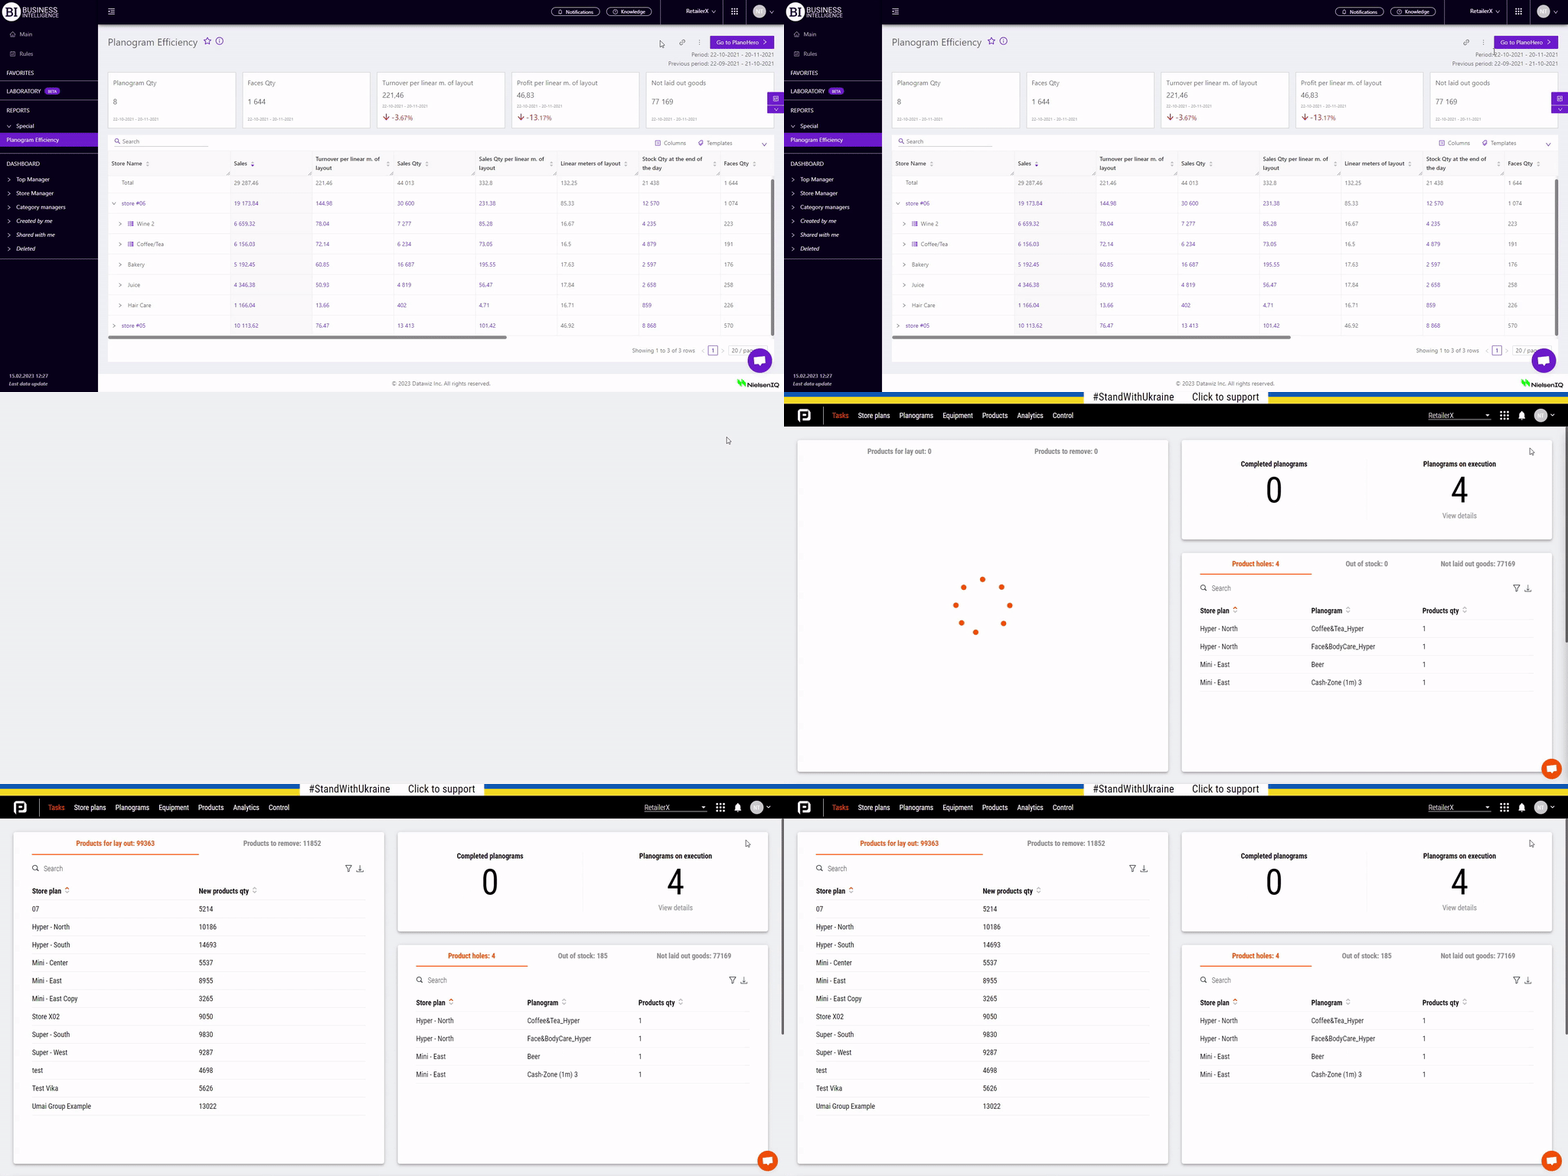
The "Go to PlanoHero" button when clicked takes you to the Main page of the PlanoHero solution.

Metrics
"Columns" button allows to choose the necessary metrics for generating a report:
Sales
- Sales
- Sales Change
- Sales % Change
- Turnover per linear m. of layout
- Turnover per linear m. of layout Change
- Turnover per linear m. of layout Change, %
- Loss of sales
- Turnover share of planogram
Sales Qty
- Sales Qty
- Sales Qty Change
- Sales Qty % Change
- Avg Sales Qty
- Sales Qty per linear m. of layout
- Sales Qty per linear m. of layout Change
- Sales Qty per linear m. of layout Change, %
- Loss of sales Qty
- Sales Qty share of planogram
Receipt Qty
- Receipt Qty
- Receipt Qty Change
- Receipt Qty % Change
- Receipts Qty per linear m. of layout
- Receipts Qty per linear m. of layout Change
- Receipts Qty per linear m. of layout Change, %
- Receipt Qty share of planogram
Avg Receipt Price
Stocks
Profit
- Profit
- Profit Change
- Profit % Change
- Profit per linear m. of layout
- Profit per linear m. of layout Change
- Profit per linear m. of layout Change, %
- Loss of profit
- Profit share of planogram
Price
Availability
Assortment activity
Product Layout
- Faces quantity
- Product stock in psc
- Product stock in days
- Linear meters of layout
- Placement depth
- Placement height
- Planogram sending date
- Planogram execution date
Filters
The selection of filters makes it possible to carry out the analysis within the specified conditions.
Filters button is placed on the right side above the report. Clicking on it opens a modal window with the following filters:
- Period
- Previous Period
- Stores
- Categories
- Products
- Assortment types
- Equipment
- Level